
Figure 4. Bulk RNA-seq on intact islets from hyperglycemic mice indicates changes in the expression of cell survival and differentiation markers.
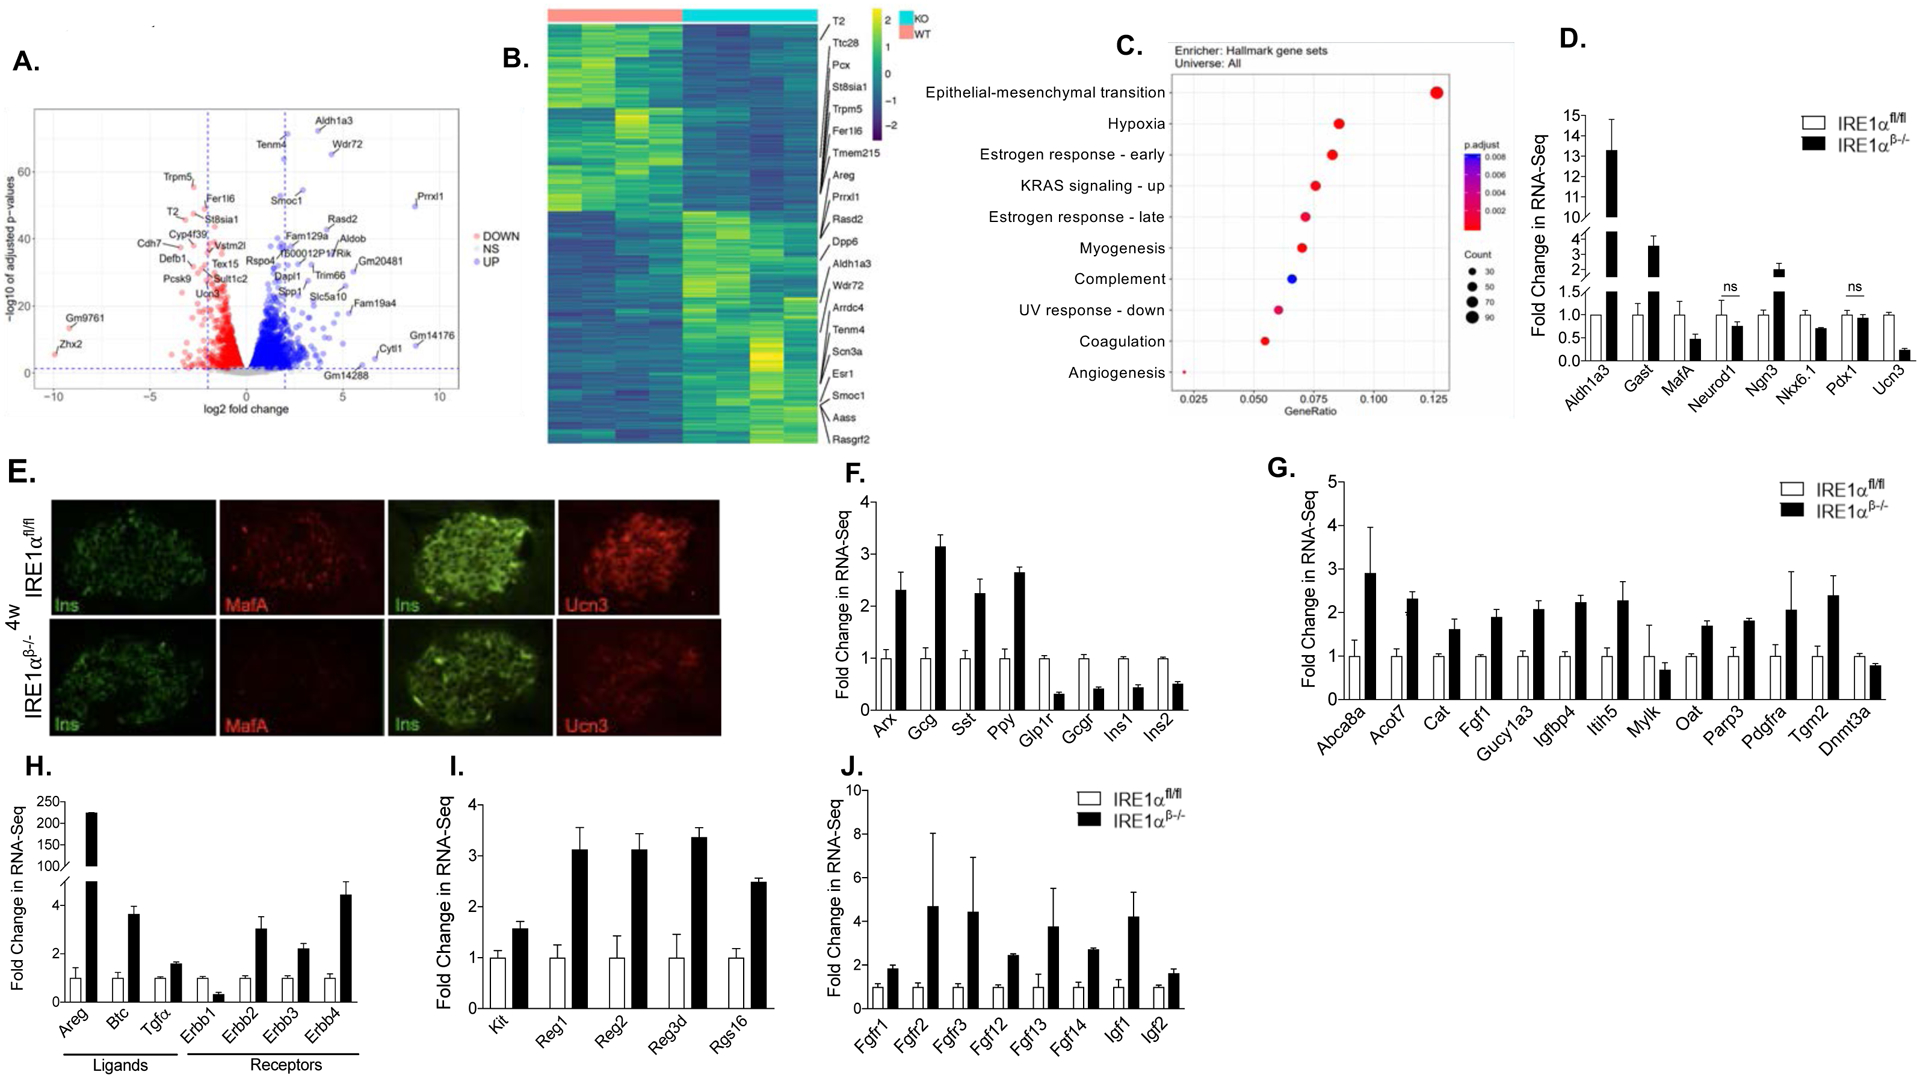
(A) Volcano plots indicating differentially expressed genes. Horizontal line depicts the FDR cutoff of 0.05 and the vertical lines mark log2 fold changes of −2 and 2. Genes with absolute log2 fold change larger than 5 or adjusted p value smaller than 1e-25 and absolute log2 fold change larger than 2 are labeled with their gene symbols.
(B) Heatmap of expression levels for the differentially expressed genes (FDR < 0.01, FC > 2).
(C) Gene set enrichment analysis with the Molecular Signatures Database (MSigDB) Hallmark gene sets (FDR < 0.05).
(D) The mRNA expression of β-cell identity and endocrine progenitor markers (FDR < 0.05).
(E) Immunofluorescence staining showing the expression of β-cell maturity markers MafA, and Ucn3.
(F-J) The mRNA expression of islet cell markers, disallowed genes, ErbB family of genes, regeneration-related genes, and growth factor gene transcripts (FDR < 0.05).
ns: non-significant, w: weeks. FC: Fold change.