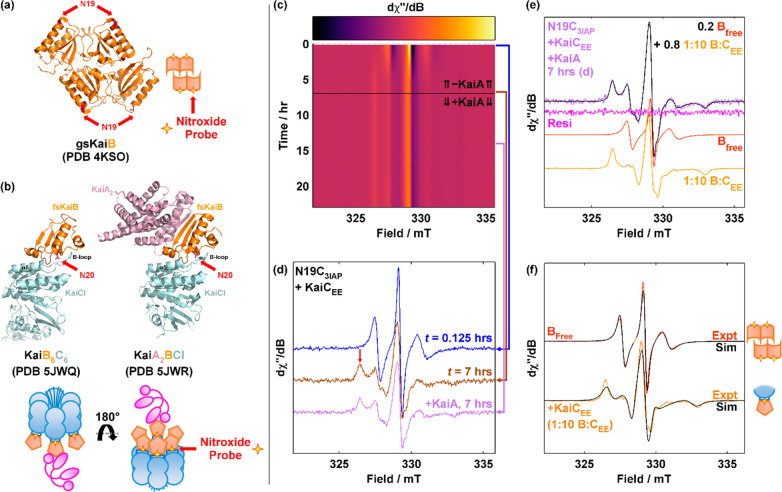
Figure 3.
KaiB-N19C-3IAP (N19C3IAP) reports KaiB–KaiC binding. (a) Crystal structure of tetrameric KaiB [Protein Data Bank (PDB) entry 4KSO] with N19 highlighted in red. (b) Crystal structures of KaiB6C6 (PDB entry 5JWQ, chains E and F) and KaiA2BCI (PDB entry 5JWR, chains A, B, E, and F) with N20 (PDB entries 5JWQ and 5JWR, T. elongatus) highlighted in red. Residue numbers of KaiB in PDB entries 5JWQ and 5JWR are offset from those of S. elongatus by +1. Color code: orange, KaiB; sky blue, KaiC; magenta, KaiA. Pictorial representations of the location of N19(N20) where 3IAP is installed are shown below the respective PDB codes. (c and d) cw-EPR spectra of N19C3IAP (5×, 17.5 μM) incubated with KaiCEE (17.5 μM) for 7 h and then spiked with KaiA (6 μM). Panel c shows a surface plot, whereas panel d shows a stacked plot at selected times. The red vertical arrow in panel d indicates B = 326 mT. (e) Reproduction of the experimental spectrum of N19C3IAP with KaiCEE and KaiA (7 h spectrum, lilac as in panel d)) with experimental spectra of free N19C3IAP (red) and N19C3IAP incubated with a 10-fold excess of KaiCEE (12 h, orange). (f) Overlay of spectral simulations (black) of free (red) and KaiCEE-bound (orange) N19C3IAP using rhombic rotational correlation times. See Table S2 for simulation parameters.

