Figure 4.

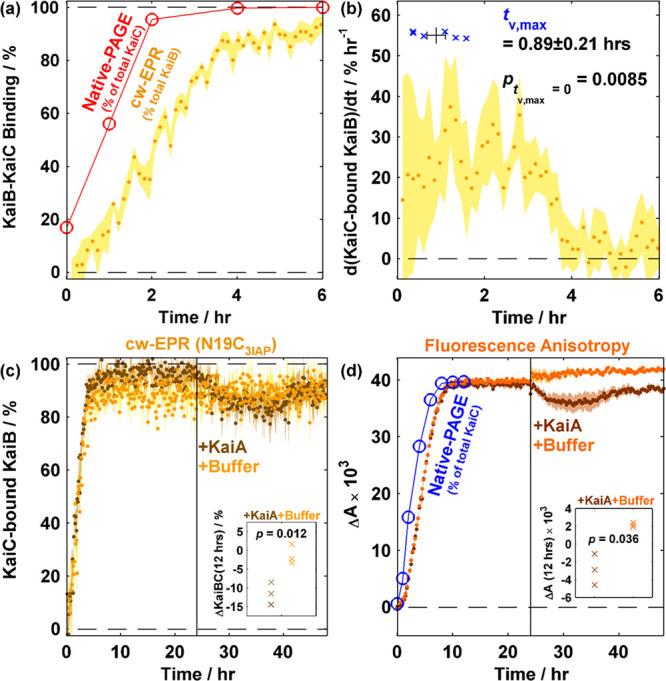
cw-EPR is an orthogonal method for quantitatively assaying KaiB–KaiC binding as illustrated by KaiB–KaiCEE binding followed by KaiA spiking at 24 h. (a) Overlay of N19C3IAP–KaiCEE binding kinetics obtained via native-PAGE (red empty circles) and cw-EPR (yellow filled circles) from 0 to 6 h. (b) Rate of formation of KaiC-bound KaiB (yellow circles) and time at maximum binding velocity (tv,max, blue crosses). For panels a and b, the shaded area (cw-EPR) and error bars (tv,max) indicate SEM (n = 6). (c) Overlay of N19C3IAP–KaiCEE cw-EPR binding kinetics followed by spiking with KaiA (brown) or buffer (yellow) at 24 h. Shaded areas show the SEM (n = 3). (d) Overlay of WT-KaiB–KaiCEE fluorescence anisotropy-based binding kinetics using 50 nM KaiB-K25C-6IAF (K25C6IAF) as a fluorescence probe with KaiA (brown) or buffer (orange) spiking at 24 h. Shaded areas show the SEM (n = 3). Insets in panels c and d show two-tailed t-tests comparing the effects of KaiA vs buffer spiking after 12 h of spiking. cw-EPR data were binned in 2 h bins prior to performing the t-test.
