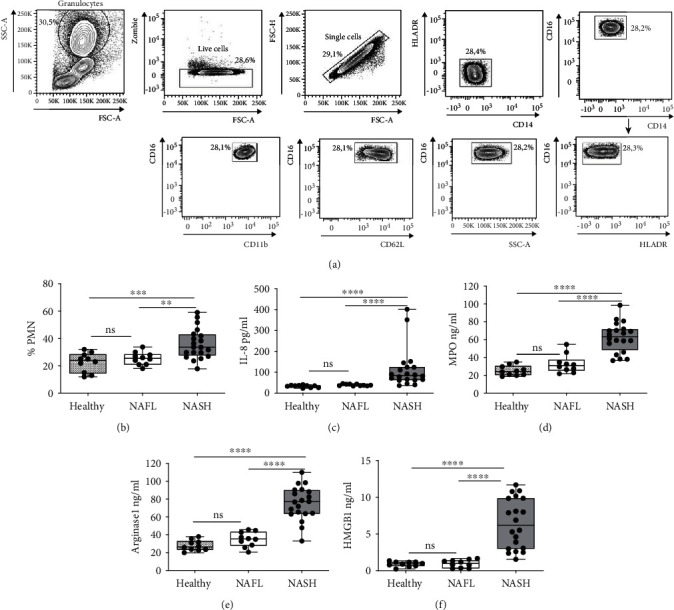
Figure 1.

Frequency of PMNs and mediators of inflammation in Healthy Donors, NAFL, and NASH patients. (a) Representative gating strategy for the flow cytometric analysis of PMNs identification from peripharial blood. PMNs are identified as SSChigh CD16high CD62Lhigh CD11bhigh. (b) Frequency was calculated by flow cytometry analysis as the percentage of CD16high CD62Lhigh CD11bhigh of PMNs in healthy donors (n = 10), NAFL (n = 10), and NASH patients (n = 20). Each dot in the dot-plot represents one subject/experiment. (c–f) Serum concentration of IL-8 pg/mL (Healthy n = 10, NAFL n = 10, and NASH n = 20) (c), MPO ng/mL (Healthy n = 10, NAFL n = 10, and NASH n = 20) (d), ARG1 ng/mL (Healthy n = 10, NAFL n = 10, and NASH n = 20) (e), and HMGB1 ng/mL (Healthy n = 10, NAFL n = 10, and NASH n = 20) (f) in healthy donors, NAFL, and NASH patients were quantified by ELISA analysis. Each dot in the graph represents a single subject. Each dot in the dot-plot represents one subject/experiment. Each subject has been studied in an independent experiment. Plots are representative for three independent experiment with one sample per experiment. Mann-Whitney unpaired test, 2-tailed. P value, ∗P < 0.05, ∗∗P < 0.01, ∗∗∗P < 0.001.
