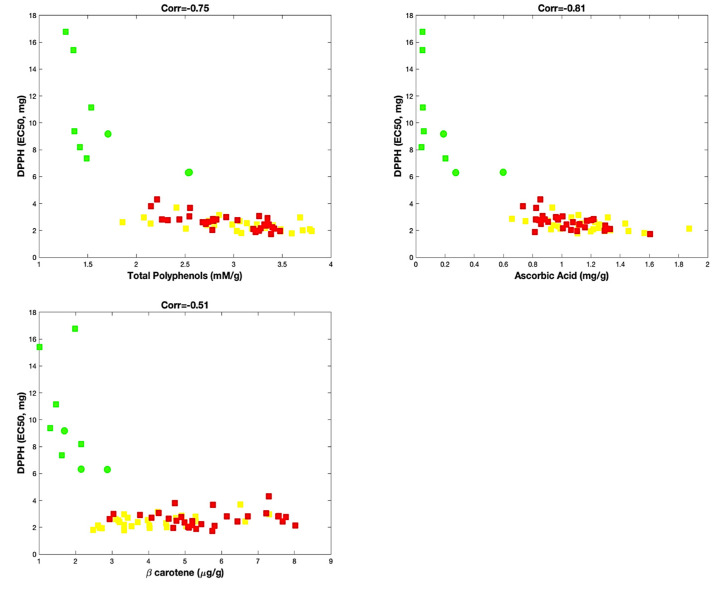
Figure 2.
Correlation analysis. Red and yellow varieties are indicated with red and yellow squares, respectively. Green varieties are represented with green squares, except samples of “Friariello Nocerese”, represented by green circles, to highlight that at least two (of three samples) resulted very similar to red and yellow samples.

