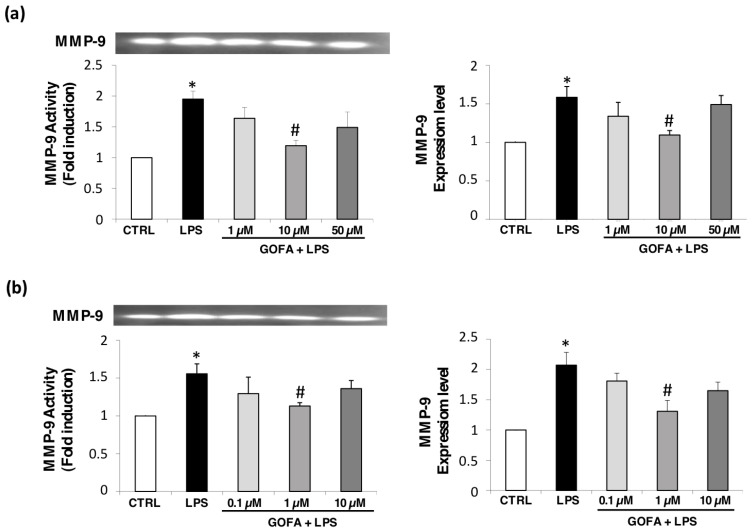
Figure 6.
GOFA effects on MMP-9 for U937 (a) and HCT-116 (b) cell lines. Cell-free conditioned media were assayed for MMP-2 and MMP-9 activity by gelatin zymography. The activity of MMP-9 (92 kDa) (bottom) was reported with fold induction values compared to control MMP-9 activity. Zymogram (top) is representative of 6 gels using 3 separate pools of total protein extracted from cell lines. Changes in MMP-9 gene expression were determined by qRT-PCR assay, using the (ΔΔCt) method and 18S as housekeeping gene. One-way ANOVA, values represent mean ± SD (n = 6); * p < 0.05 vs. control cells; # p < 0.05 vs. cell treated with LPS alone.

