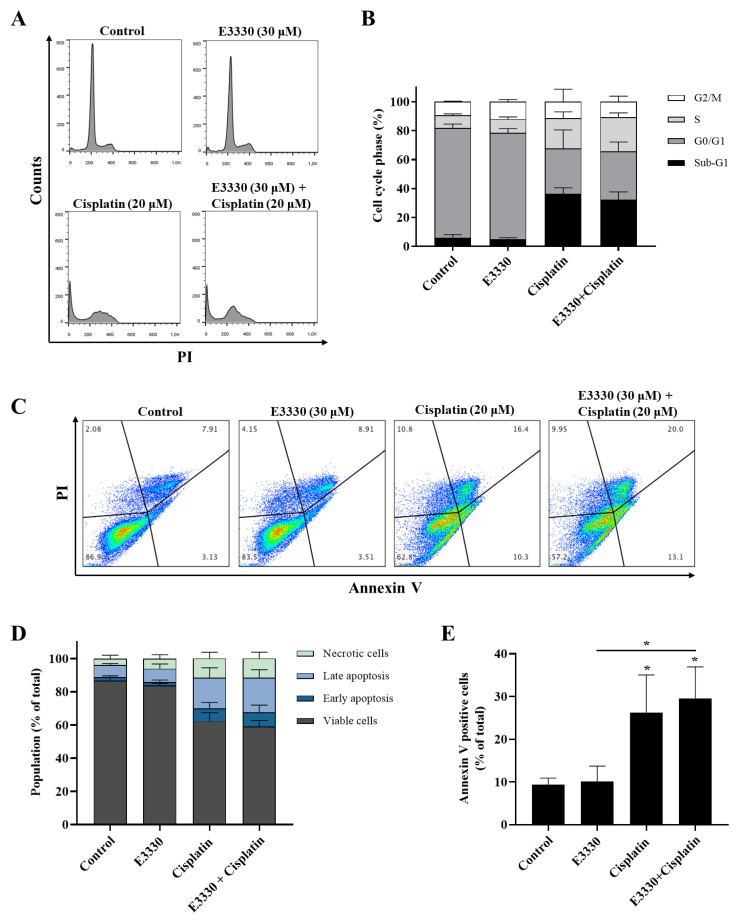
Figure 5.
Cell cycle progression and apoptosis of H1975 cells treated with E3330 and/or cisplatin. Cells were pre-incubated with E3330 (30 µM) for 3 h and then cisplatin (20 µM) was added for co-incubation for further 72 h. After this exposure period, cell DNA content analysis with PI staining was performed by flow cytometry. (A) Representative flow cytometry histograms. (B) Sub-G1, G0/G1, S, and G2/M populations’ summary results. The percentage of apoptotic cells was determined by PI and Annexin V staining after the same incubation profile as in the cell DNA content analysis. (C) Representative flow cytometry dot-plots. (D) Percentage of viable cells, cells undergoing early and late apoptosis, and necrotic cells summary results. (E) Summary results demonstrate the percentage of apoptotic cells (Annexin V positive cells). Values represent mean ± SD (n = 3), * p < 0.05 (one-way ANOVA with Tukey’s test).

