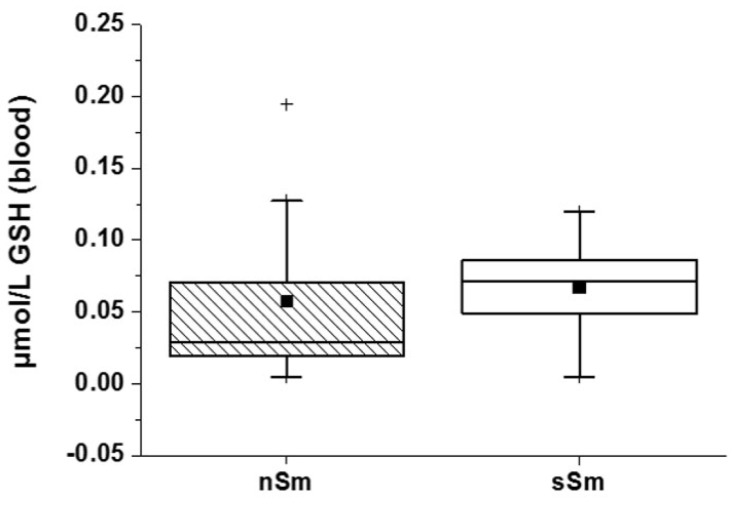
Figure 5.
Basic status (time 0 h) of GSH concentration in blood plasma between non-smokers (nSm) and strong smokers (sSm, ≥ 10 cigarettes/day), (n = 10 each), as measured by fluorimetric assay). Boxplot chart with percentile 25, 75, median (black line), mean (black square) and outlier (black cross).

