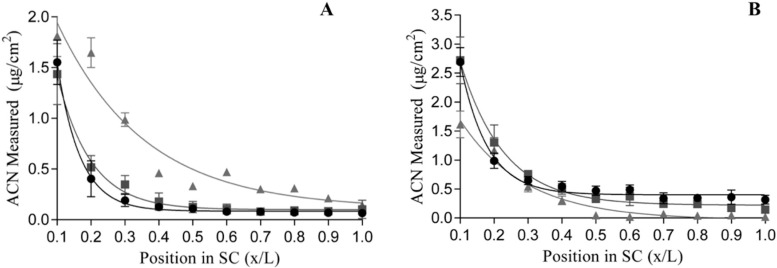
Figure 3.
Relative position (depth) within the stratum corneum (SC, x/L) of mean anthocyanin amounts (μg/cm−2) ((A): elderberry; (B): red radish) as determined by HPLC in vivo ( ), and PLS-R of FTIR spectra in vivo (
 ) and ex vivo (
 ). Means are shown as the average of triplicate samples from six participants. The lines are the best fit for Equation (A1) used to determine permeability and diffusivity of the formulas.

