Figure 1.
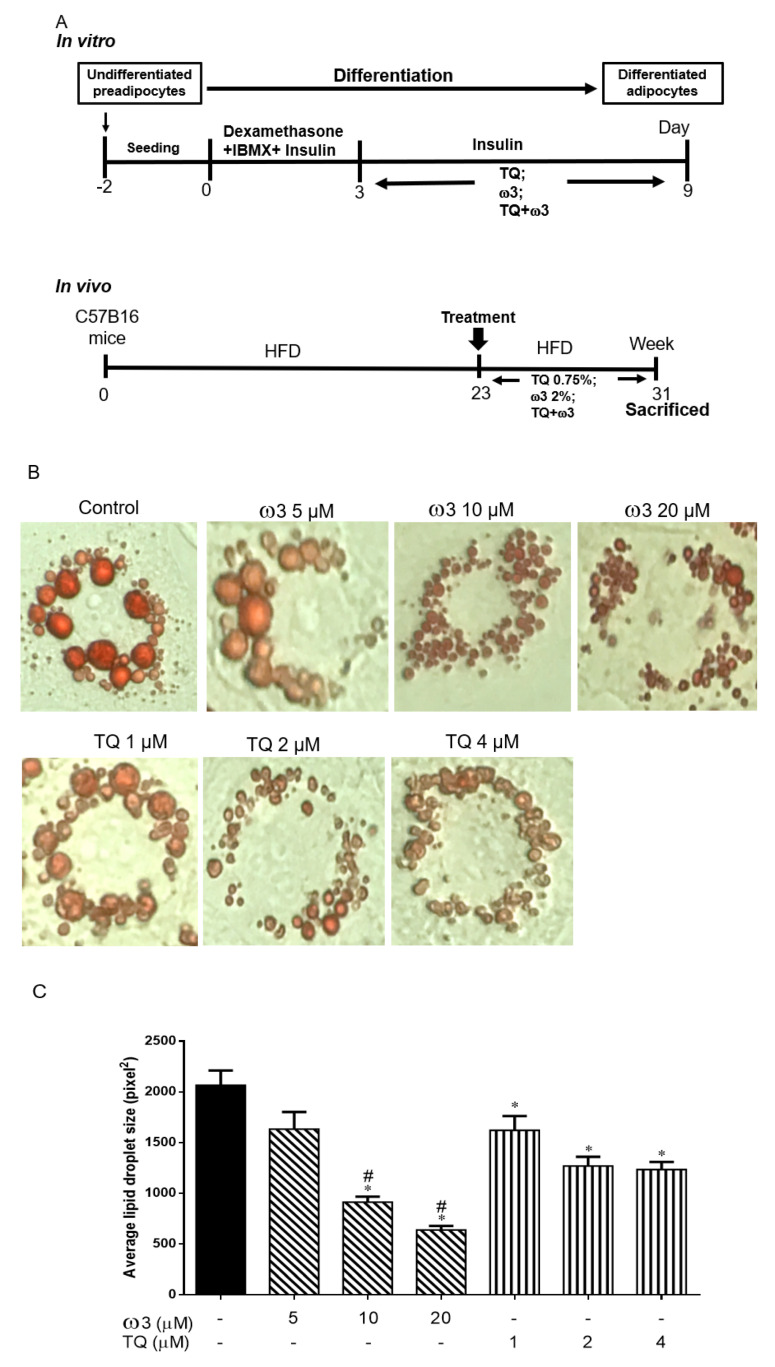
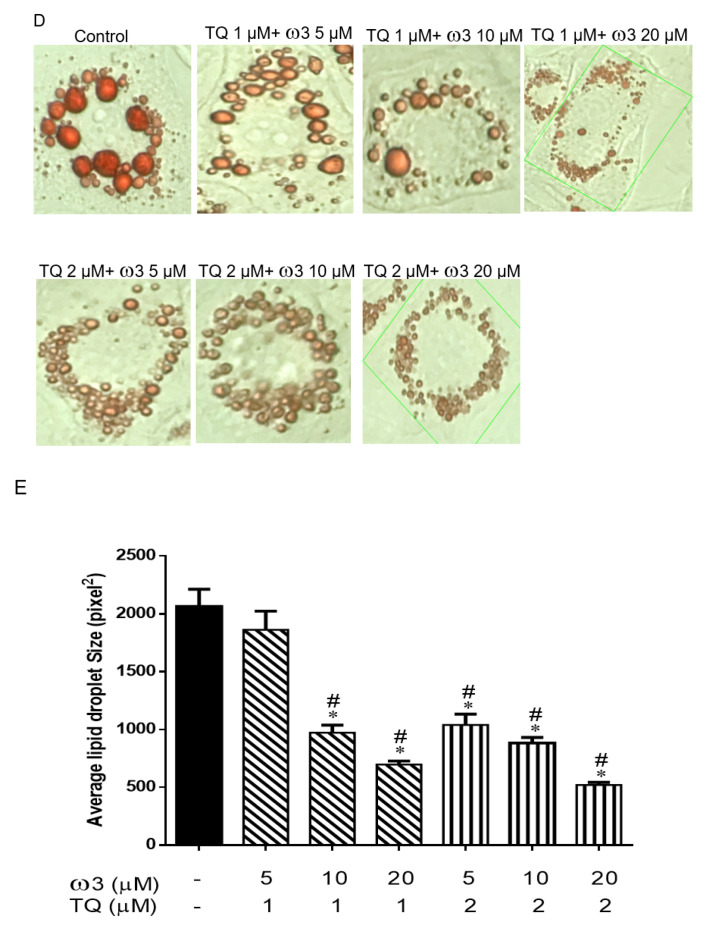
Scheme of the experimental protocol and dose-dependent effects of thymoquinone (TQ) and omega 3 (ω3) treatment on lipid droplets in 3T3-L1 adipocytes. Scheme of the in vitro and in vivo protocol (A). Representative and graph of the cells treated with TQ (1–4 μM), ω3 (5–20 μM) (B and C), and a combination of TQ (1–2 μM) and ω3 (5–20 μM) (D and E) for six days (n = 4); *p < 0.05 vs Control; #p < 0.05 vs ω3 5 µM. HFD—high-fat diet; IBMX—3-isobutyl-1-methylxanthine.


