Figure 9.

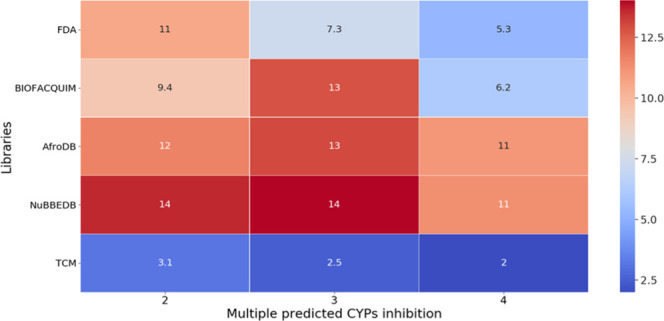
Heat map for the prediction of multiple inhibitions of cytochromes. The Y-axis represents different libraries. The X-axis indicates the frequencies to inhibit CYPs per compound.

Heat map for the prediction of multiple inhibitions of cytochromes. The Y-axis represents different libraries. The X-axis indicates the frequencies to inhibit CYPs per compound.