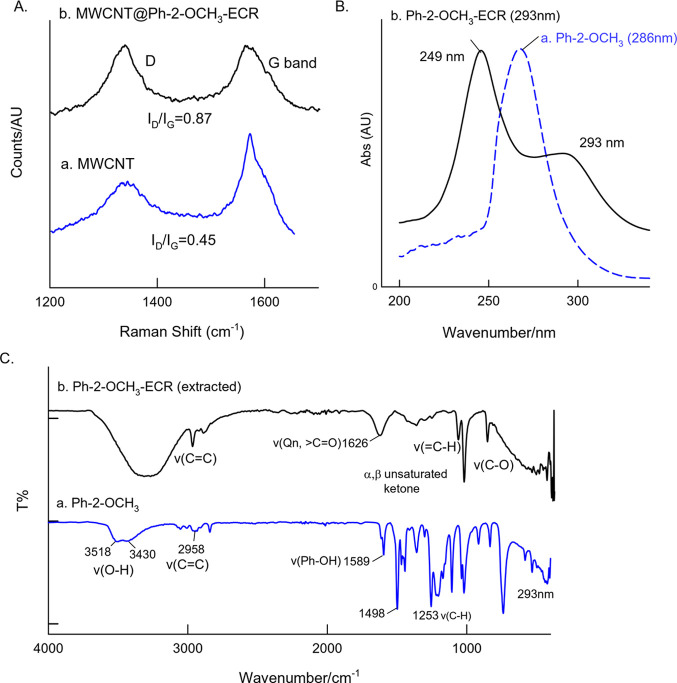
Figure 6.
Comparative characterization of the MWCNT@Ph-2-OCH3-ECR with control samples by (A) Raman, (B) UV–vis, and (C) FTIR spectroscopic analysis. For Raman analysis, samples were prepared on a disposable screen-printed electrode as an underlying surface. The MWCNT@Ph-2-OCH3-ECR sample was extracted from the test electrode using ethanol as a solvent.

