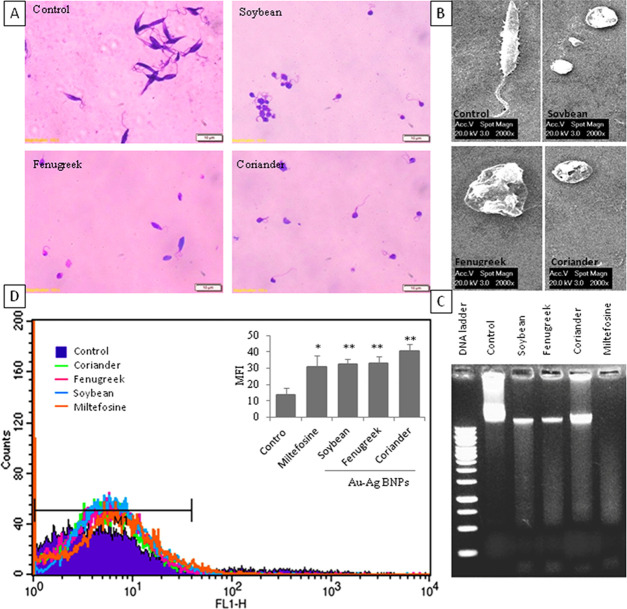
Figure 6.
BNPs induced apoptosis-like features in promastigotes. (A) Light microscopy analysis of morphological alteration in Giemsa-stained promastigotes (scale 10 μm). (B) SEM analysis of morphological aberrations in promastigotes (scale 2000×). (C) Genomic DNA fragmentation as a smear in promastigotes. (D) H2DCF fluorescence intensity measured in the FL1-H channel by a flow cytometer, and intracellular ROS production in promastigotes represented as MFI (insert), “p values” are represented as *p ≤ 0.05 and **p ≤ 0.01.

