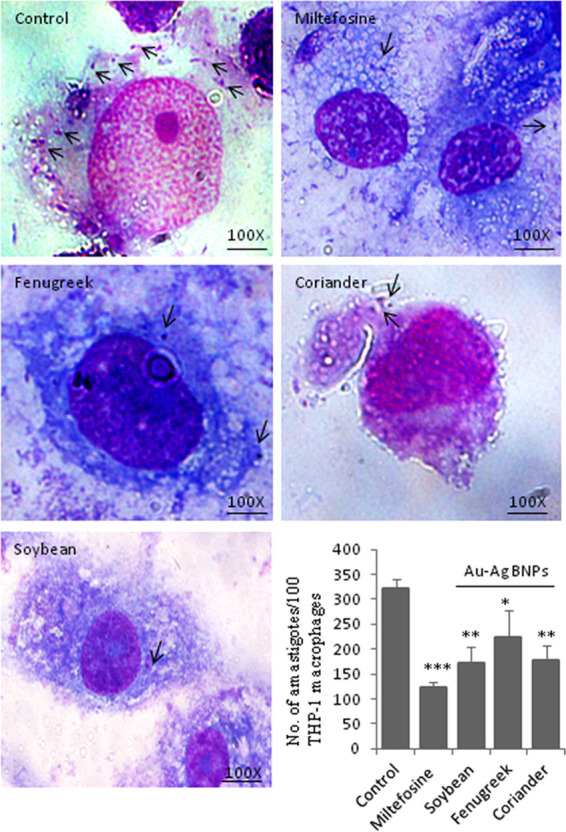
Figure 7.

Effect of BNPs on amastigote growth; light microscopic analysis and counting of intracellular amastigotes present inside the Giemsa-stained THP-1 macrophages (scale 100×) and indicated with arrow marks. The average number of amastigotes per 100 macrophages is shown in the bar graph, and p values are represented as *p ≤ 0.05, **p ≤ 0.01, and ***p ≤ 0.001.
