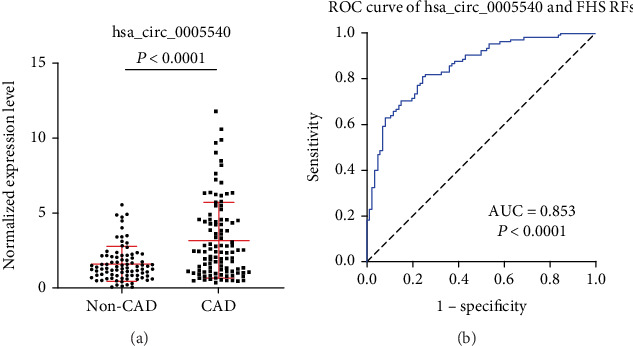
Figure 4.

Expression level and ROC curve analysis of exosomal hsa_circ_0005540 in two-center validation cohorts. (a) Expression level of hsa_circ_0005540. (b) ROC curve analysis of exosomal hsa_circ_0005540 combined with FHS RFs for diagnosis of CAD.
