
Figure 5.
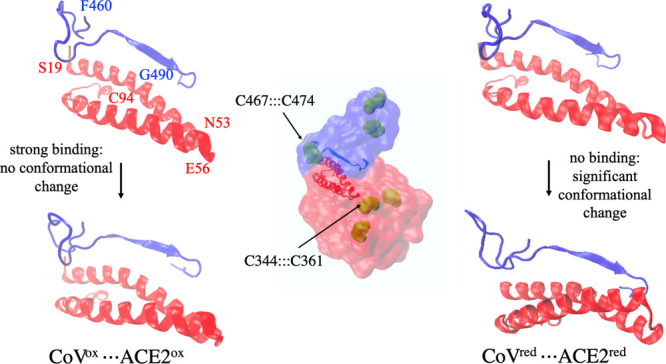
Comparison of the conformational change at the protein–protein interface in CoVox···ACE2ox (left) and CoVred···ACE2red (right). CoV and ACE2 subunits in the complex are shown in blue and red colors, respectively, at the center. The structural motif containing the two helices of ACE2 and a β sheet of the CoV (or CoV-2) was monitored before (top) and after (bottom) 20 ns MD simulation. The left and right panels show the difference in conformational changes in the oxidized form (CoVox···ACE2ox) and reduced form (CoVred···ACE2red), respectively.