Figure 3.

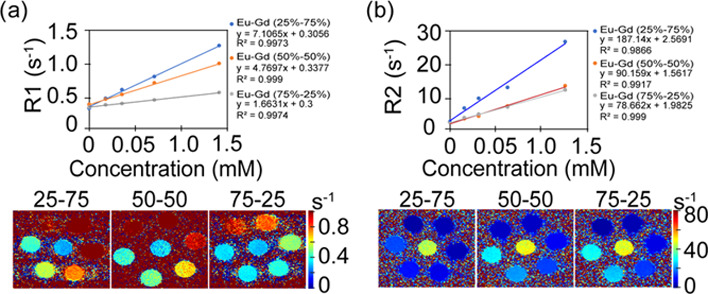
(a) R1 relaxivity and T1 map images, (b) R2 relaxivity and T2 map images of Eu–Gd nanoparticles. Both relaxivity and map images are changing with concentration variations of NPs.

(a) R1 relaxivity and T1 map images, (b) R2 relaxivity and T2 map images of Eu–Gd nanoparticles. Both relaxivity and map images are changing with concentration variations of NPs.