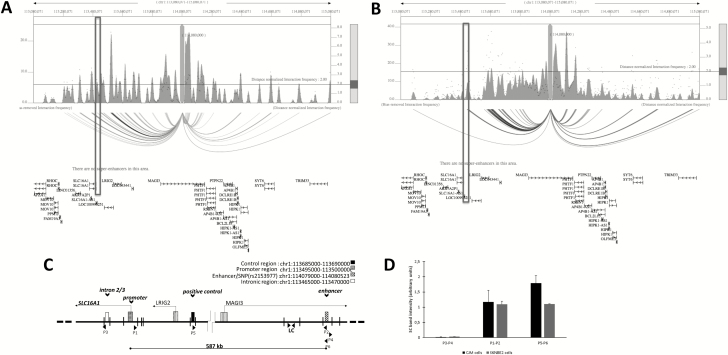
Figure 3.
The enhancer containing rs2153977 interacts with the SLC16A1 promoter in CMM and NB cells. Plot of HiC data of NB and CMM cells. NB cells (SKNSH) (A) and CMM cells (SKMEL5) (B). One-to-all interaction plot of HiC data (3DIV database) is shown for rs2153977 enhancer region as bait. Y-axes in the left and the right indicate bias-removed interaction frequency and distance-normalized interaction frequency (dots), respectively. Horizontal line indicates the cutoff for distance-normalized interaction frequency. Shown is arc-representation of significant interaction for the given cutoff value defined by the Horizontal line. The boxes indicate the SLC16A1 promoter. (C) Schematic representation of approximate positions regions analyzed and direction of transcription of genes, and EcoRI cutting sites within the area are displayed. Primers P1 and P2 were designed to amplify a novel ligation product formed between the restriction fragments that encode the promoter region and enhancer DNA, respectively. Intronic DNA fragment primers (P3 and P4) and a positive control primers (P5 and P6) are shown. LC is an internal region unaffected by digestion used as loading control. (D) A chromatin conformation capture (3C) assay was performed using the Enhancer/SNP region as an anchor (P2, P4, P6), and the interaction between the enhancer/SNP region and distal elements [intronic region (P3), promotor region (P1) and control region (P5)] in CJM and SKNBE2 cells was assessed. The interaction frequency corresponds with the intensity of amplified PCR products analyzed gels are shown in Supplementary Figure 5 and Supplementary Material (available at Carcinogenesis Online). Data are shown as mean ± SD.

