Fig. 2.
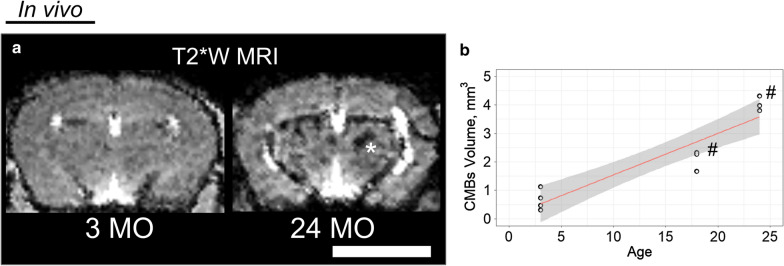
T2*W MRI located the hemosiderin deposits of CMBs in vivo. a A large CMB region was visible in the old-aged mouse is labeled with * in the MRI slice shown. b The relationship found between CMBs presence visible in T2*W MRI and the age of mice in months was significant in the linear regression model (p < 0.001; R2 value of 0.8716). The volume of CMBs was measured in vivo manually as the area of CMBs on an image multiplied by the slice thickness. Resolution (140 µm3 isotropic) was minimized to prevent partial volume effects. Quantification indicated increasing presence of CMBs in relation with aging (# indicates a p value is less than 0.01 by ANOVA followed by Tukey multiple pairwise-comparisons). The white bar represents a scale bar with size of 5 mm

