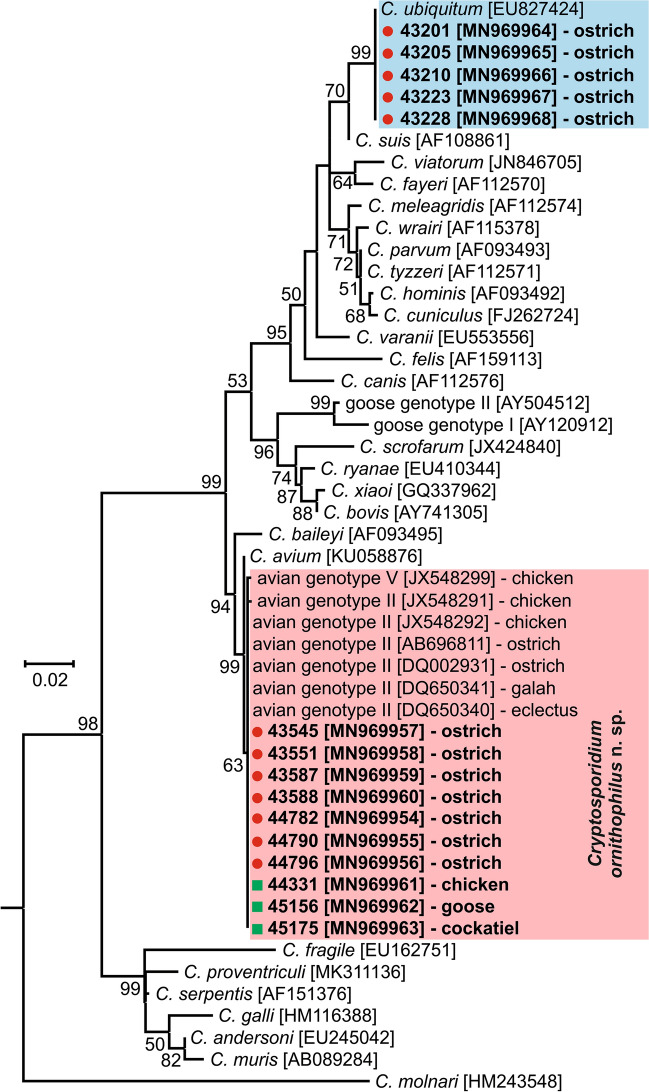
Fig. 1.
Maximum likelihood tree (− ln = 3130.05) based on partial sequences of the gene encoding the small subunit rRNA (SSU), including sequences obtained in this study from naturally (red circle and bolded) and experimentally (green square and bolded) infected hosts. Tamura’s 3-parameter model was applied, using a discrete Gamma distribution and invariant sites. The robustness of the phylogeny was tested with 1000 bootstrap pseudoreplicates and numbers at the nodes represent the bootstrap values > 50%. The scale-bar indicates the number of substitutions per site. Sequences obtained in this study are identified by isolate number (e.g. 43201)

