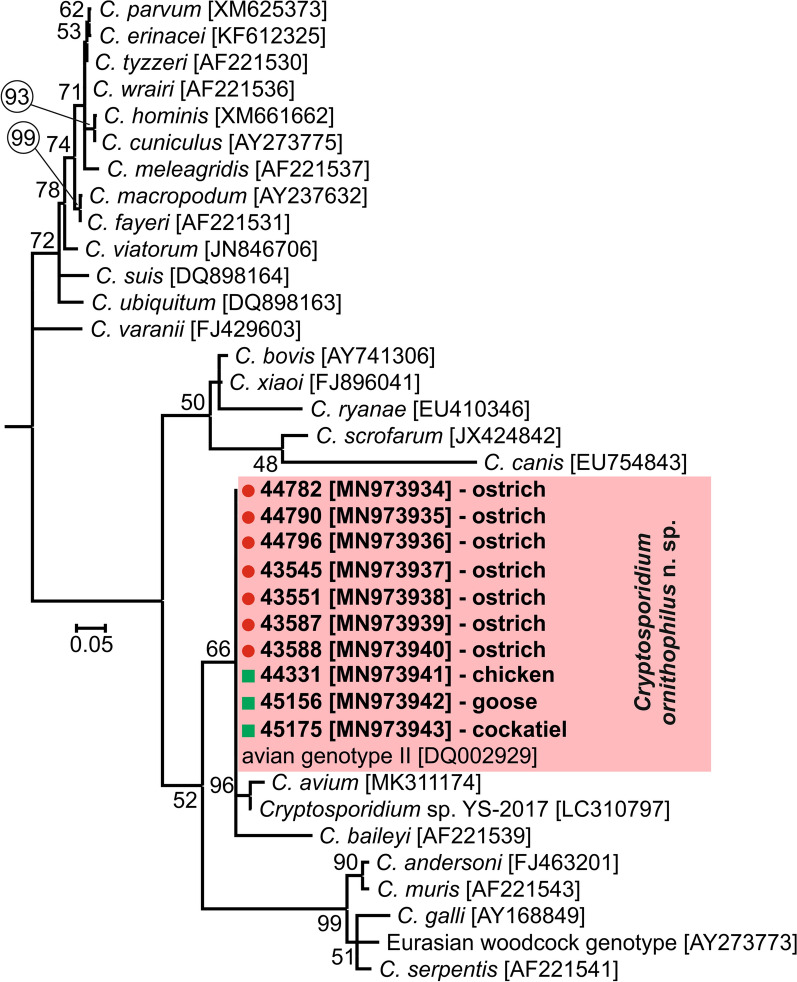
Fig. 3.
Maximum likelihood tree (− ln = 2009.56) based on partial sequences of the 70 kDa heat-shock protein gene, including sequences obtained in this study from naturally (red circle and bolded) and experimentally (green square and bolded) infected hosts. Tamura’s 3-parameter model was applied, using a discrete Gamma distribution and invariant sites. The robustness of the phylogeny was tested with 1000 bootstrap pseudoreplicates and numbers at the nodes represent the bootstrap values > 50%. The scale-bar indicates the number of substitutions per site. Sequences obtained in this study are identified by isolate number (e.g. 43201)

