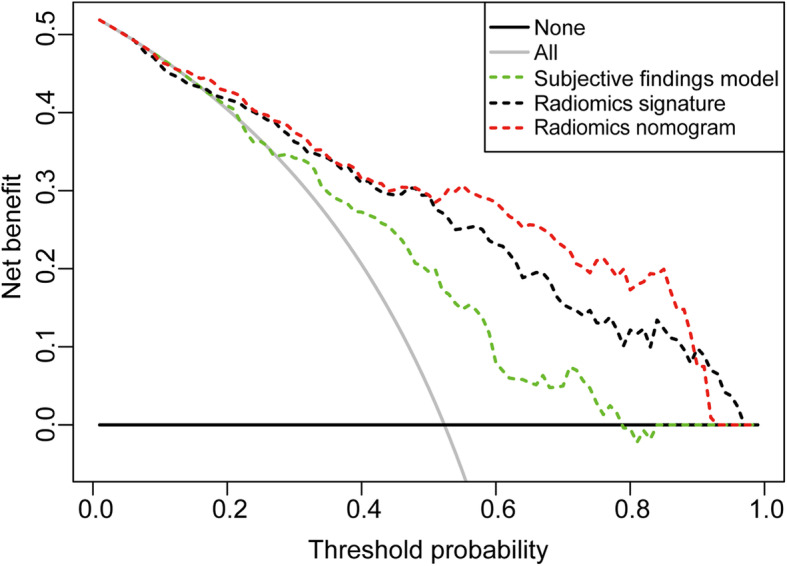
Fig. 7.

Decision curve analysis of the prediction models. The y-axis represented the net benefit. The dotted red line represented the radiomics nomogram model. The dotted green line represents the subjective findings model. The dotted black line represented the radiomics signature model. The solid gray line represented the assumption that all patients had lung adenocarcinomas. The solid black line represented the hypothesis that all patients had granulomatous lesions. The x-axis represented the threshold probability. The threshold probability was where the expected benefit of treatment was equal to the expected benefit of no treatment. The decision curve showed that the radiomics nomogram added more net benefit than the subjective findings model within the range of 0.13 to 0.98
