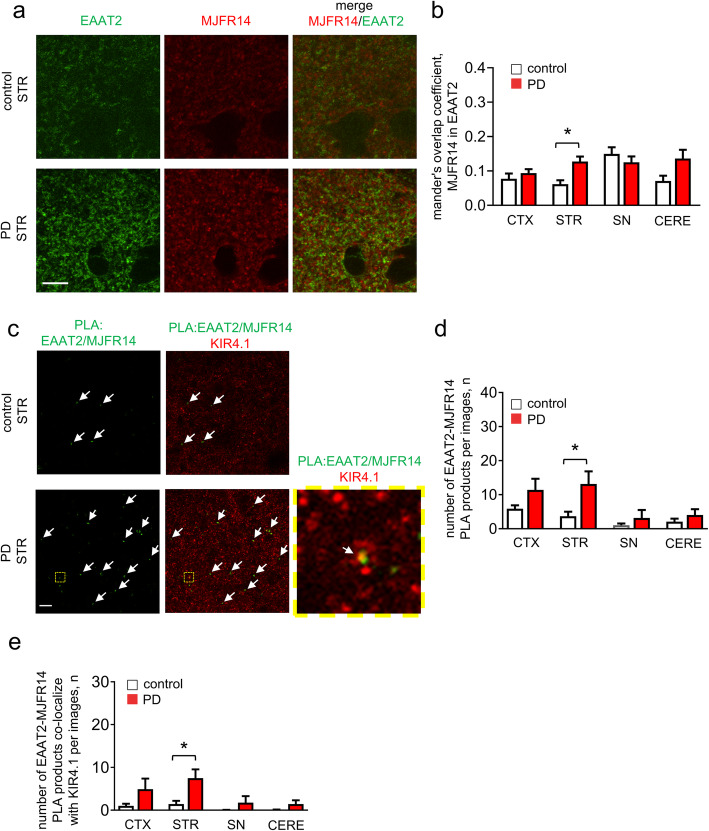
Fig. 7.
Oligomeric α-syn shows a close proximity with EAAT2 at the astrocytic endfeet in human brain tissue. a Representative images of human postmortem tissues (striatum (STR)) co-labeled for oligomeric α-syn and EAAT2. Note overlap of oligomeric α-syn with EAAT2 (Scale bar, 10 μm). b Quantification analysis of oligomeric α-syn/EAAT2 co-localization in cortex (CTX), striatum (STR), substantia nigra (SN) and cerebellum (CERE) (means + S.E.M; n ≥ 5; *p < 0.05 by One-way ANOVA test). c Representative images of human postmortem tissues (striatum (STR)) containing EAAT2/oligomeric α-syn complexes (proximity ligation products indicated by white arrows). Note that EAAT2/oligomeric α-syn complexes often co-localized with Kir4.1 labeled astrocytic endfeet (Scale bar, 10 μm). d-e Quantification analysis of number EAAT2/oligomeric α-syn complexes (d) or overlapping with Kir4.1 labeled astrocytic endfeet (e) in cortex (CTX), striatum (STR), substantia nigra (SN) and cerebellum (CERE) of healthy control or PD human postmortem tissues (means + S.E.M; n = 5; *p < 0.05 by One-way ANOVA test)

