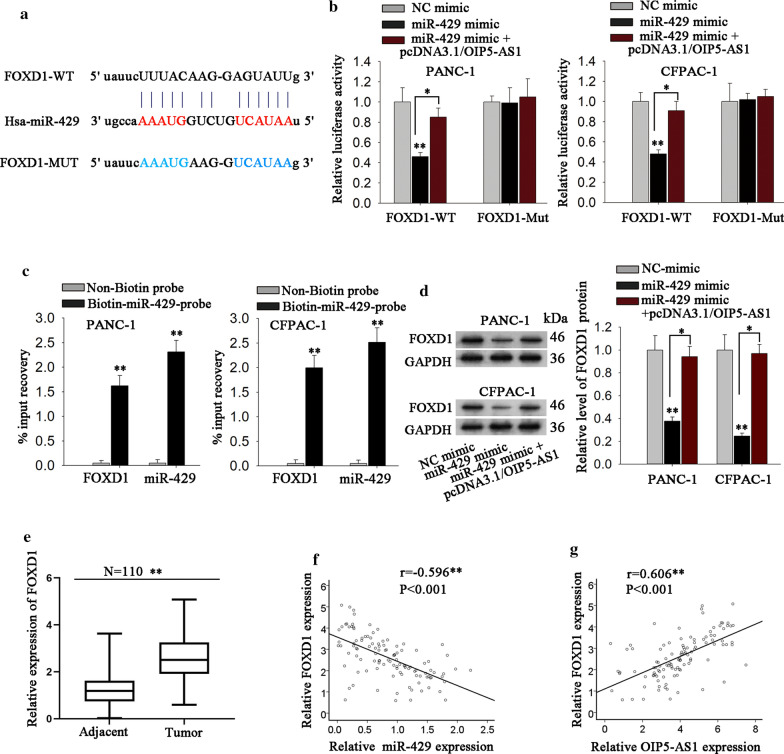
Fig. 4.
MiR-429 directly targets to FOXD1 and its level is negatively correlated with FOXD1 level. a StarBase conjectured the binding sites between FOXD1 3′UTR and miR-429. b Luciferase activity in different groups was detected by luciferase reporter assay (*P < 0.05, **P < 0.01). c RNA pull-down assay was applied to detect the interaction between FOXD1 and miR-429 (**P < 0.01). d The protein expression of FOXD1 in diverse groups was measure by western blot (*P < 0.05, **P < 0.01). e RT-qPCR tested FOXD1 expression in 110 pairs of PDAC tissues (**P < 0.01). f Pearson’s correlation analysis detected the correlation between miR-429 and FOXD1 level in PDAC tissues (***P < 0.001). g Pearson’s correlation analysis unveiled the positive correlation between OIP5-AS1 and FOXD1 expression in PDAC tissues (***P < 0.001). *P< 0.05, **P < 0.01, ***P < 0.001 indicated data were statistically significant

