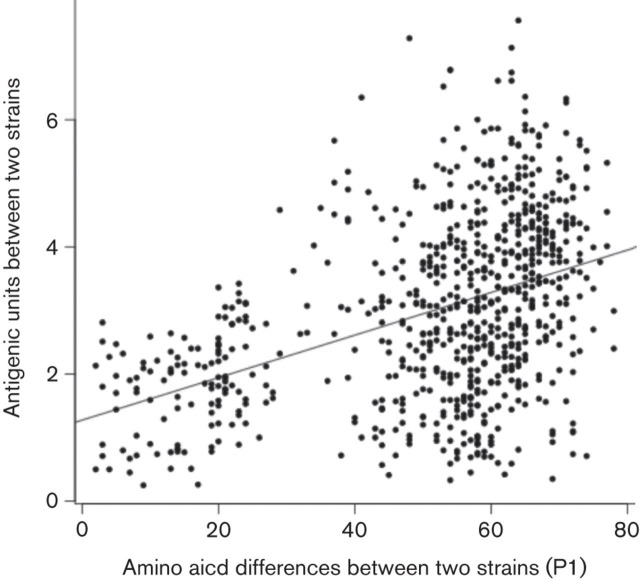
Fig. 3.
Pair-wise antigenic and genetic distance (P1) between viruses. The antigenic distances were derived from the three-dimensional antigenic map of FMDV serotype A. Pearson’s correlation coefficient was 0.42 (95 % CI is 0.36–0.48; P<2.2×10⁻¹⁶). The Spearmans’s rank correlation (ρ) was equal to 43 %.

