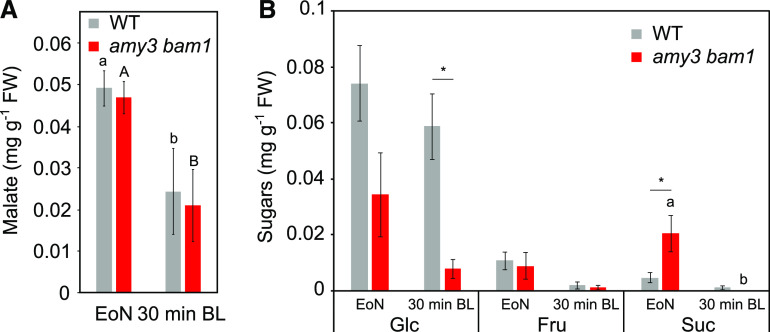
Figure 2.
Metabolite Quantification in Wild-Type and amy3 bam1 Guard Cells under BL.
Malate (A) and soluble sugar (B) contents of wild-type and amy3 bam1 guard-cell–enriched epidermal peels at the EoN and after 30 min of incubation in stomatal opening buffer under 75 μmol m−2 s−1 of BL. FW, fresh weight. Data for two independent experiments are shown (means ± se; n ≥ 6). Different letters indicate statistically significant differences among time points for the given genotype. Asterisk (*) indicates statistically significant difference between genotypes for the given time point for P < 0.05 determined by one-way ANOVA with post hoc Tukey’s test.

