Figure 3.
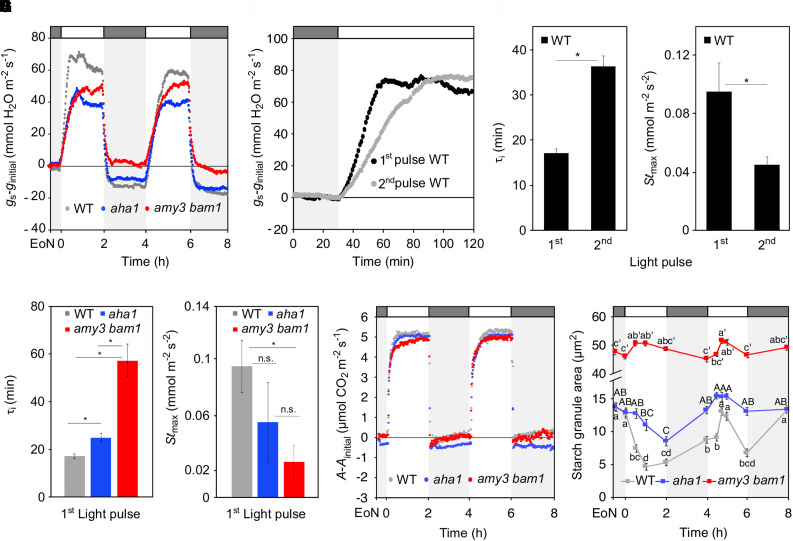
Stomatal Opening Kinetics and Guard Cell Starch Dynamics in Plants Subjected To a Two-Pulsed–Light Treatment.
(A) Normalized whole-plant recordings of gs–ginitial values in dark-adapted (30 min) plants in response to 2-h L, 2-h D, 2-h L, and 2-h D (L, light; D, darkness). Plants were illuminated with 150 μmol m−2 s−1 white light. The gs values were normalized to values at the EoN. Number of measured plants per genotype n ≥ 3; values presented are means. WT, wild type.
(B) Changes in gs–ginitial values in response to a shift from dark to light in wild-type plants. Data are taken from (A).
(C) to (F) Rapidity of the stomatal response estimated using a time constant (τ [C]) and the maximum slope of gs increase (Slmax, D) during the two consecutive pulses of light in the wild type ([C] and [D]) and during the first pulse in all three genotypes ([E] and [F]). Unpaired student’s t test determined statistical significance between the indicated comparisons (*P < 0.05; n.s., not significant).
(G) Normalized whole-plant recordings of A-Ainitial values from plants under the same light regime as given in (A). Values for A were normalized to values at the EoN. Number of measured plants per genotype n ≥ 3; values presented are means.
(H) Guard cell starch dynamics of plants under the same light regime as given in (A). Each value represents mean ± se of three biological replicates of >110 individual guard cells obtained from three independent experiments. Different letters indicate statistically significant differences among time points for the given genotype for P < 0.05 determined by one-way ANOVA with post hoc Tukey’s test.

