
Figure 4.
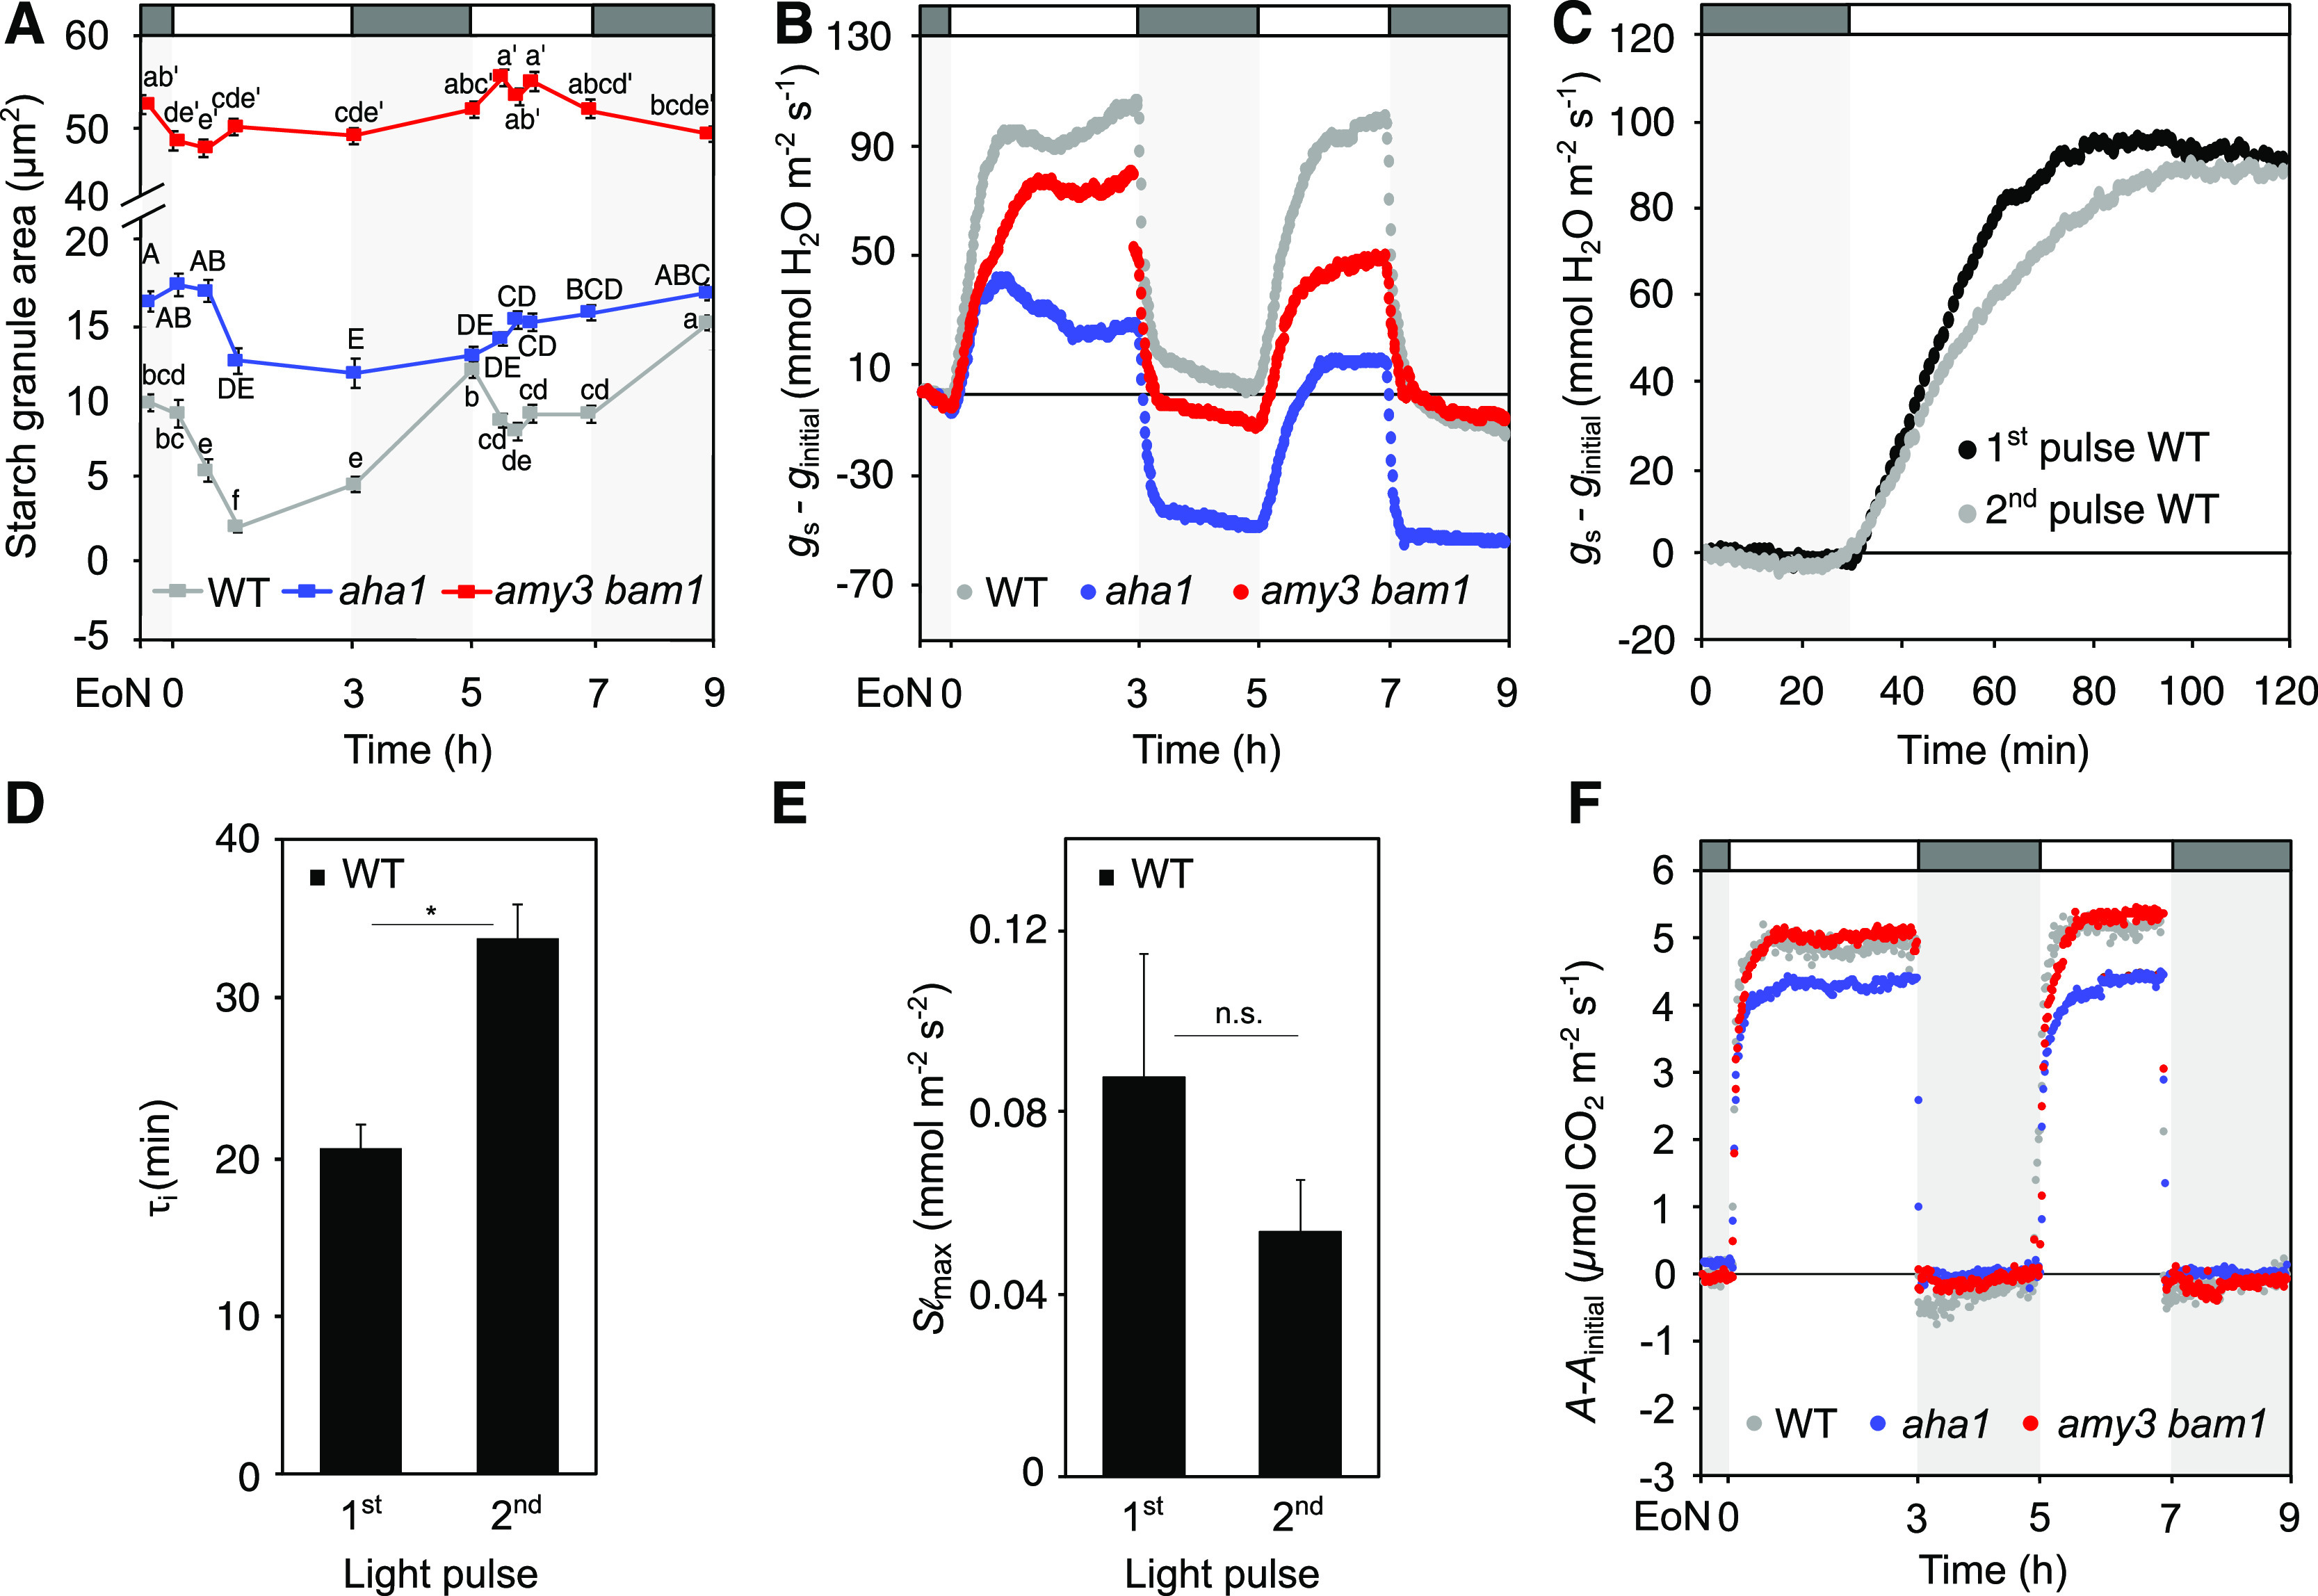
Stomatal Opening Kinetics and Guard Cell Starch Dynamics in Plants Subjected to a Modified Two-Pulsed–Light Treatment.
(A) Guard cell starch dynamics in dark-adapted (30 min) plants in response to 3-h L, 2-h D, 2-h L, and 2-h D (L, light; D, darkness). Plants were illuminated with 150 μmol m−2 s−1 white light. Each value represents mean ± se of three biological replicates of >110 individual guard cells obtained from three independent experiments. Different letters indicate statistically significant differences among time points for the given genotype for P < 0.05 determined by one-way ANOVA with post hoc Tukey’s test. WT, wild type.
(B) Normalized whole-plant recordings of gs–ginitial values in plants exposed to the same light regime as given in (A). The gs values were normalized to values at the EoN. Number of measured plants per genotype n ≥ 3; values presented are means.
(C) Changes in gs–ginitial values in response to a shift from dark to light in wild-type plants. Data are replotted from (B).
(D) and (E) Rapidity of the stomatal response estimated using a time constant (τ [D]) and the maximum slope of gs increase (Slmax [E]) during the two consecutive pulses of light in the wild type. Unpaired Student’s t test determined statistical significance between the indicated comparisons (*P < 0.05; n.s., not significant).
(F) Normalized whole-plant recordings of A-Ainitial values from plants under the same light regime as given in (B). Values for A were normalized to values at the EoN. Number of measured plants per genotype n ≥ 3; values presented are means.