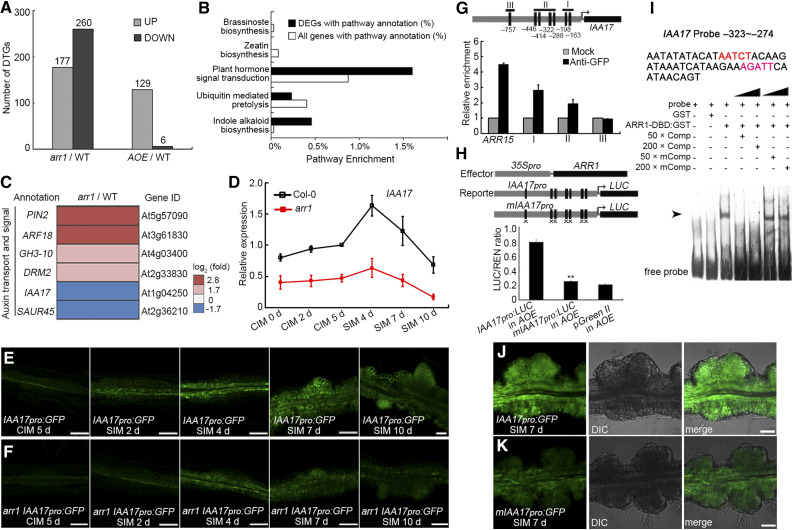
Figure 7.
ARR1 Promotes the Expression of IAA17 via Binding to its Promoter.
(A) DTGs in arr1 vs. Col-0 and AOE vs. Col-0.
(B) Pathway enrichment of DTGs in arr1 vs. Col-0.
(C) Transcript profiling of DTGs related to auxin transport and signaling from arr1 vs. Col-0.
(D) Transcript abundance of IAA17 in root explants derived from Col-0 and arr1 explants cultured on CIM or SIM at different stages. The relative expression level was normalized with the data of Col-0 CIM 5 d.
(E) and (F) Temporal and spatial expression patterns of IAA17 in wild-type (E) and arr1 (F) root explants after culturing on CIM for 5 d and on SIM for 2, 4, 7, and 10 d. The arr1 IAA17pro:GFP lines were obtain via plant crossing of arr1 and IAA17pro:GFP.
(G) The enrichment of IAA17 promoter fragments following ChIP.
(H) Transient expression assay showing that ARR1 promotes IAA17 expression.
(I) ARR1 binds to the promoter region of IAA17 (indicated by arrows) in an EMSA.
(J) and (K) Temporal and spatial expression patterns of IAA17pro:GFP and mIAA17pro:GFP in root explants at the nascent SAM formation stage. Black boxes refer to the cytokinin response motif 5′-(A/G)GAT(T/C)-3′ and black boxes marked with “×” denote A-to-C and G-to-C point mutations (Supplemental Data Set 1). **Differ at P < 0.01 (Student’s t test). Scale bar = 50 μm. Two independent transgenic lines were analyzed for each genetic background, with similar expression patterns ([E], [F], [J], and [K]). DIC, differential interference contrast field of microscopy.

