Figure 6.
PIN2 Polarity Is Altered in the tripp-1 Mutant.
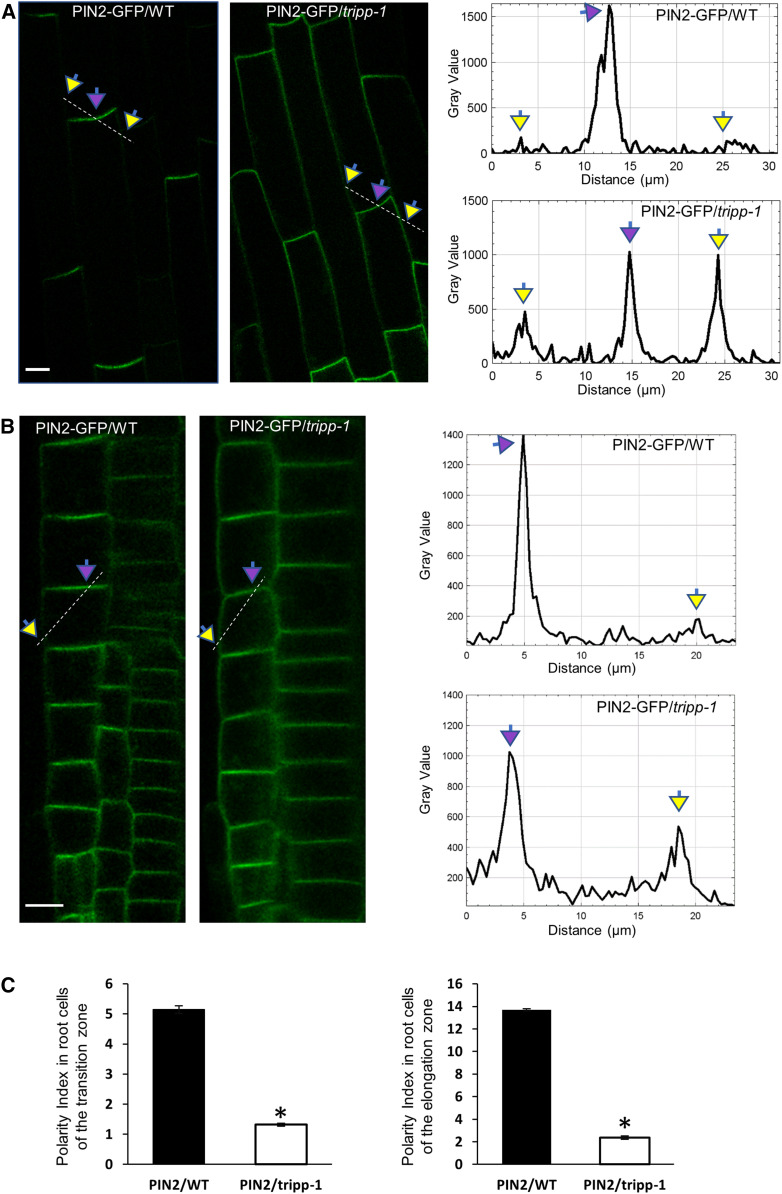
Confocal images of 7-d-old seedlings. Apical and lateral membranes are marked by purple and yellow arrows, respectively.
(A) Cells in the root elongation zones of the wild-type (WT) and tripp-1 seedlings expressing 35S:PIN2-GFP. PIN2 exhibits apical localization on the plasma membrane in WT. PIN2 exhibits apical and lateral plasma membrane localization in tripp-1. Dashed lines correspond to the area of quantification of PIN2-GFP signals across the apical and lateral plasma membrane. n = 10. Bar = 10 µm.
(B) Cells in the root transition zones of the wild-type (WT) and tripp-1 seedlings expressing 35S:PIN2-GFP. PIN2 exhibits apical localization on the plasma membrane in WT. PIN2 exhibits apical and lateral plasma membrane localization in tripp-1. Dashed lines correspond to the area of quantification of PIN2-GFP signals across the apical and lateral plasma membrane. n = 10. Bar = 10 µm.
(C) Quantitative polarity index (Łangowski et al., 2016) of PIN2-GFP in the wild type (WT) and tripp-1, representing the ratio of the mean signal in the polar membrane to that in the lateral membrane. n = 5 seedlings. Data reported as means ± se. *, P < 0.001 (two-tailed t test).

