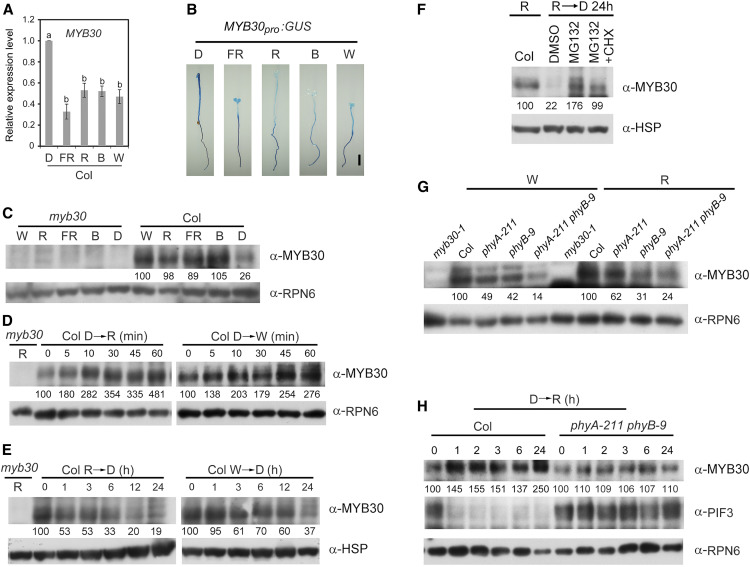
Figure 3.
MYB30 Transcript and Protein Levels Are Differentially Regulated by Light.
(A) RT-qPCR analysis of MYB30 expression. Data show the relative expression of MYB30 in Col seedlings grown for 4 d in D or continuous FR light (5 µmol m−2 s−1), R light (20 µmol m−2 s−1), B light (10 µmol m−2 s−1), and W light (40 µmol m−2 s−1). Error bars represent se of three different pools of seedlings. Different letters represent statistical significances determined by ANOVA with Tukey’s post hoc test (P < 0.05; Supplemental Data Set 3).
(B) GUS staining of homozygous MYB30pro:GUS transgenic seedlings. Seedlings were grown for 4 d in D or continuous FR light (5 µmol m−2 s−1), R light (20 µmol m−2 s−1), B light (10 µmol m−2 s−1), or W light (10 µmol m−2 s−1). Bar = 1 mm.
(C) Immunoblots showing MYB30 protein levels in 4-d-old myb30-1 (left side) and Col seedlings (right side) grown in D or continuous W light (40 µmol m−2 s−1), R light (20 µmol m−2 s−1), FR light (5 µmol m−2 s−1), or B light (10 µmol m−2 s−1).
(D) Immunoblots showing MYB30 protein levels in 4-d-old etiolated Col seedlings transferred to R light (20 µmol m−2 s−1) or W light (40 µmol m−2 s−1) for the indicated time periods.
(E) Immunoblots showing MYB30 protein levels in 4-d-old Col seedlings grown in R light (20 µmol m−2 s−1) or W light (40 µmol m−2 s−1) and then transferred to D for the indicated time periods.
(F) Immunoblots showing that the degradation of MYB30 proteins in the dark was inhibited by MG132. Col seedlings grown in R light (20 µmol m−2 s−1) for 4 d were soaked in half-strength liquid Murashige and Skoog medium containing either 150 µM MG132 alone, 150 µM MG132 plus 150 µM cyclohexamide (CHX, a protein synthesis inhibitor), or an equal volume of DMSO (the solvent for MG132) and then transferred to D for 24 h before immunoblotting.
(G) Immunoblots showing MYB30 protein levels in 4-d-old Col, phyA-211, phyB-9, and phyA-211 phyB-9 seedlings grown in continuous W light (40 µmol m−2 s−1) or R light (20 µmol m−2 s−1).
(H) Immunoblots showing MYB30 protein levels in Col and phyA-211 phyB-9 seedlings upon R light treatment. Col and phyA-211 phyB-9 seedlings grown in D for 4 d were transferred to R light (20 µmol m−2 s−1) for the indicated time periods and were then analyzed by immunoblotting.
In (C), (D), (G), and (H), anti-RPN6 was used as a sample loading control. In (E) and (F), anti-HSP was used as a sample loading control. Numbers below the immunoblots in (C) to (H) indicate the relative intensities of MYB30 bands normalized to those of loading controls, and the ratio was set to 100 for the first lane of each group.

