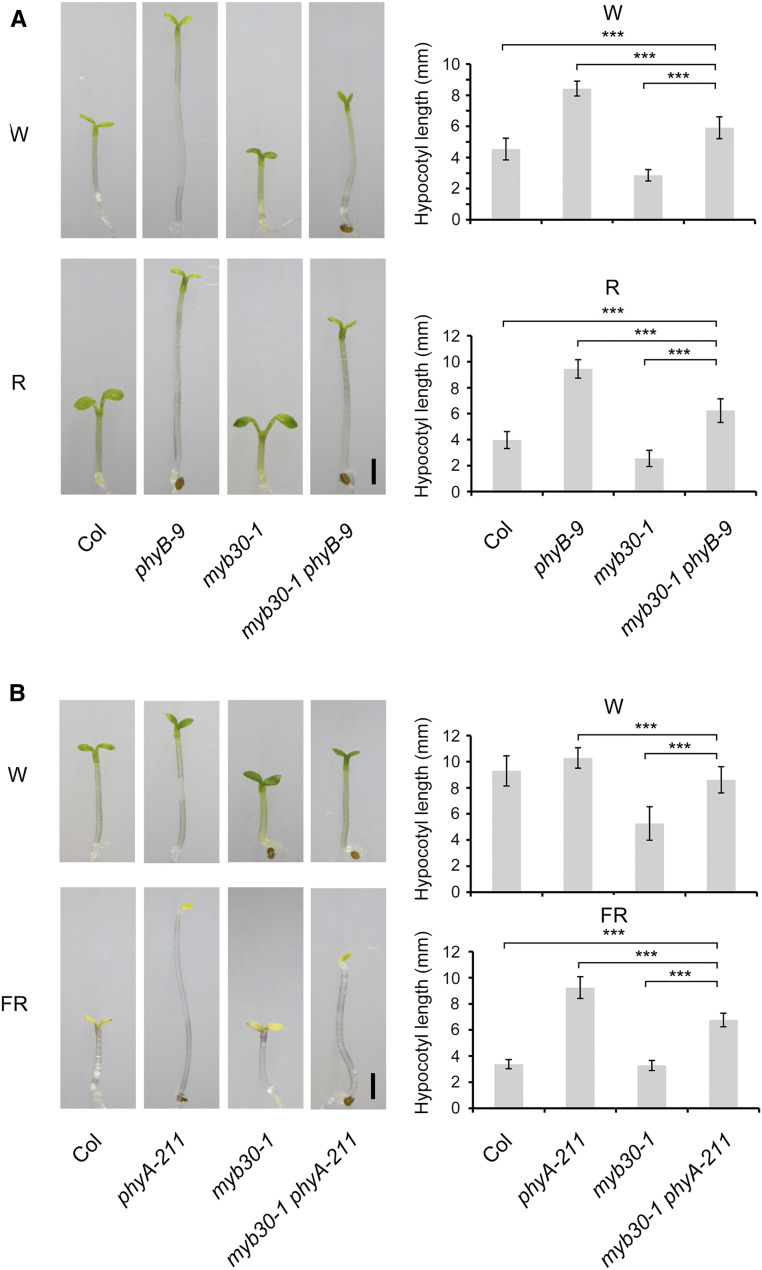
Figure 4.
Genetic Relationship between MYB30 and phyA/phyB.
(A) Phenotypes and hypocotyl lengths of Col, phyB-9, myb30-1, and myb30-1 phyB-9 seedlings grown in W light (10 µmol m−2 s−1) or R light (60 µmol m−2 s−1) for 4 d.
(B) Phenotype and hypocotyl lengths of Col, phyA-211, myb30-1, and myb30-1 phyA-211 seedlings grown in W light (10 µmol m−2 s−1) or FR light (5 µmol m−2 s−1) for 4 d.
Error bars represent sd from at least 15 seedlings. ***, P < 0.001 (Student’s t test; Supplemental Data Set 3) for the indicated pairs of seedlings. Bar in (A) and (B) = 1 mm.

