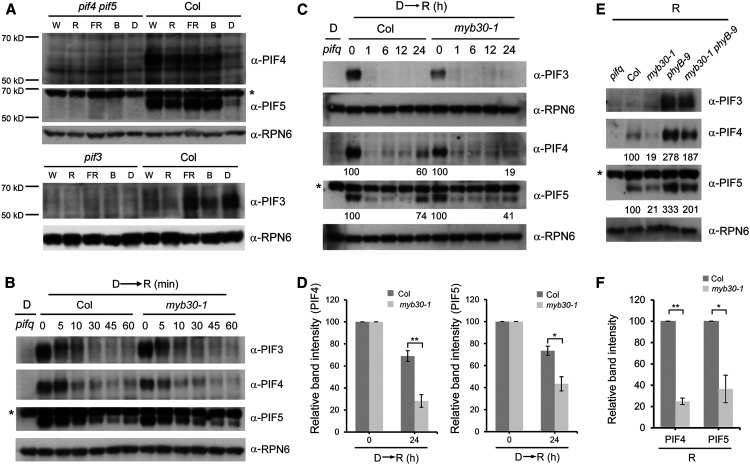
Figure 8.
MYB30 Promotes PIF4 and PIF5 Protein Accumulation under Prolonged R Light.
(A) Immunoblots showing the levels of PIF4, PIF5, and PIF3 in 4-d-old Col seedlings grown in either D or continuous W light (40 µmol m−2 s−1), R light (20 µmol m−2 s−1), FR light (40 µmol m−2 s−1), or B light (10 µmol m−2 s−1) conditions.
(B) and (C) Immunoblots showing the levels of PIF3, PIF4, and PIF5 proteins in 4-d-old etiolated Col and myb30-1 mutant seedlings transferred to R light (60 µmol m−2 s−1) for the indicated times within 1 h (B) and 24 h (C). Numbers below the immunoblots indicate the relative intensities of PIF4 and PIF5 bands normalized to those of RPN6 at the indicated times, and the ratio was set to 100 for the respective band before R light treatment.
(D) Relative intensities of PIF4 and PIF5 bands at the indicated times shown in (C). Error bars represent se from three independent assays using different pools of seedlings. *, P < 0.05 and **, P < 0.01 (Student’s t test; Supplemental Data Set 3).
(E) Immunoblots showing the levels of PIF3, PIF4, and PIF5 proteins in 4-d-old Col, myb30-1, phyB-9, and myb30-1 phyB-9 seedlings grown in continuous R light (60 µmol m−2 s−1). Numbers below the immunoblots indicate the relative band intensities of PIF4 and PIF5 normalized to those of RPN6, and the ratio was set to 100 for the respective band in Col.
(F) Relative intensities of PIF4 and PIF5 bands in Col and myb30-1 shown in (E). Error bars represent se from three independent assays using different pools of seedlings. *, P < 0.05 and **, P < 0.01 (Student’s t test; Supplemental Data Set 3).
Asterisk in each anti-PIF5 blot indicates a cross-reacting band. Anti-RPN6 was used as a sample loading control.

