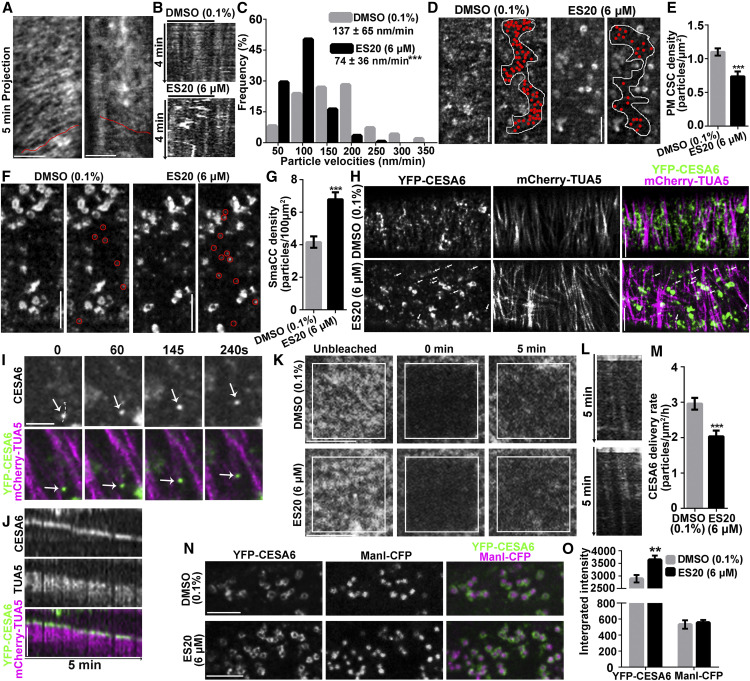
Figure 5.
ES20 Disrupts Trafficking of CSCs to the PM.
(A) to (C) ES20 reduces the velocity of CSCs at the PM. Representative time projections using average intensity images from a time-lapse series of YFP-CESA6 particles in root epidermal cells (A). Kymographs (B) of the trajectories marked in (A). Histogram with the frequencies of YFP-CESA6 particle velocity after treatment with 0.1% DMSO or 6 μM ES20 for 30 min (C). Data in the chart represent mean ± sd (n = 320 CSC trajectories from 18 seedlings per treatment).
(D) and (E) ES20 treatment reduces the abundance of PM-localized YFP-CESA6 in root epidermal cells. Representative images (D) and quantification (E) of PM-localized YFP-CESA6 in root epidermal cells after 0.1% DMSO or 6 μM ES20 treatment are shown. Data represent means ± se (n = 20 cells from 10 seedlings).
(F) and (G) Density of cortical SmaCCs, as indicated by red circles, increased in response to ES20 treatment (30 min). Data represent means ± se (n = 20 cells from 10 seedlings per treatment).
(H) CSCs were depleted from the PM after treatment with 6 μM ES20 for 2 h, whereas microtubule-associated CESA compartments accumulated, as indicated by white arrows.
(I) Magnified view of the association of a CESA compartment (arrows) with microtubules in time-course image after 6 μM ES20 treatment for 2 h.
(J) Kymograph showing the association of the CESA compartment with the microtubules as shown in (I).
(K) to (M) ES20 reduces the delivery rate of CSCs to PM in root epidermal cells. Representative images of CSCs at the PM during FRAP analysis (K). Representative kymographs of the trajectories of newly delivered CSCs after photobleaching (L). Quantification of CSC delivery rates (M) based on the FRAP assays described in (K). Data represent means ± se (n = 18 ROIs from 15 seedlings).
(N) and (O) ES20 increases the abundance of CSC at the Golgi. Representative images of Golgi-localized YFP-CESA6 and ManI-CFP after 0.1% DMSO (top) or 6 μM ES20 (bottom) treatment for 1 h (N). Quantification of integrated fluorescence intensity of Golgi-localized CSCs and ManI (O) as described in (N). Data represent means ± se (n = 60 from 14 seedlings). **, P < 0.01 and ***, P < 0.001 by two-tailed Student’s t test. Bar = 5 μm.

