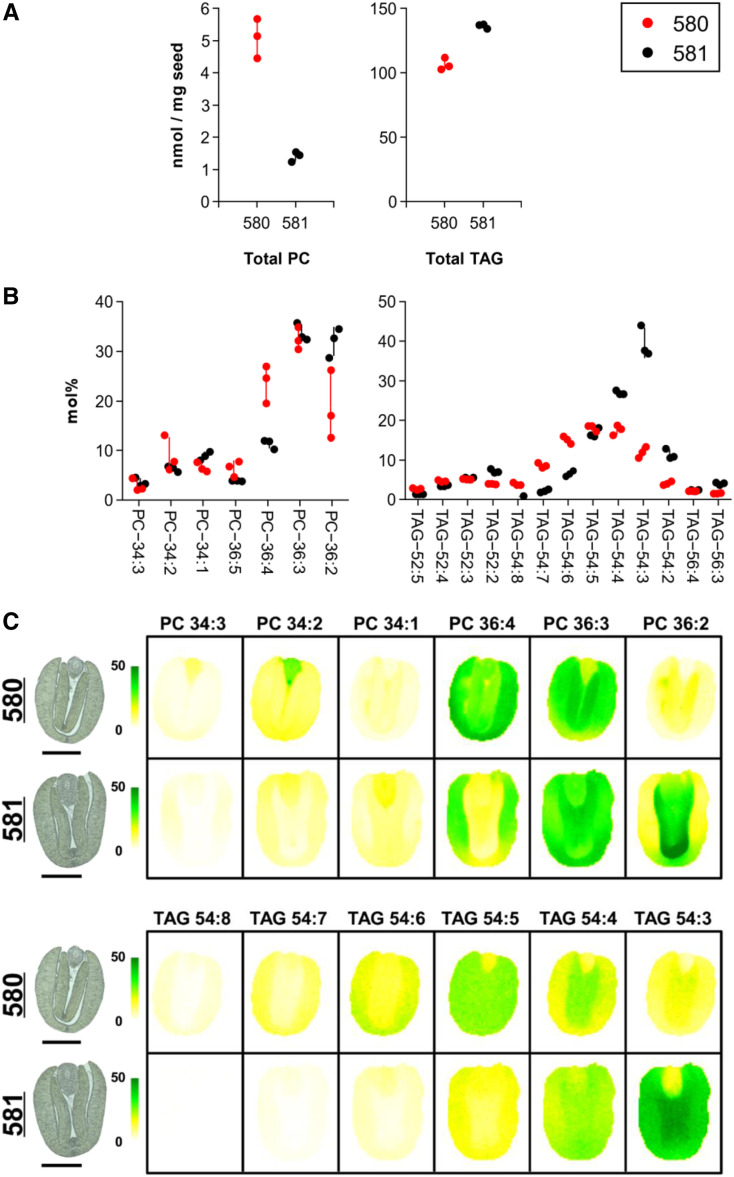
Figure 5.
The Level and Distribution of Storage and Membrane Lipids in the Seed.
(A) Mean contents of PC and TAGs as measured using electrospray ionization (ESI)-MS. Data are given in nmol/mg seed.
(B) Mean contents of individual molecular species of PC/TAGs as measured using ESI-MS. Data are given in mol%.
Data in both (A) and (B) are plotted for each of the three replicates with the sd lines centered around the mean.
(C) MS-acquired images showing the spatial distribution of PC and TAGs. The abundance of each compound type is shown as mol% on a colored scale from yellow (low) to green (high). Images captured by light microscopy of the sections used for MS imaging are shown to the left of the MS-acquired ones. See also Supplemental Figure 5 for biological replicates. Bars = 1 mm.

