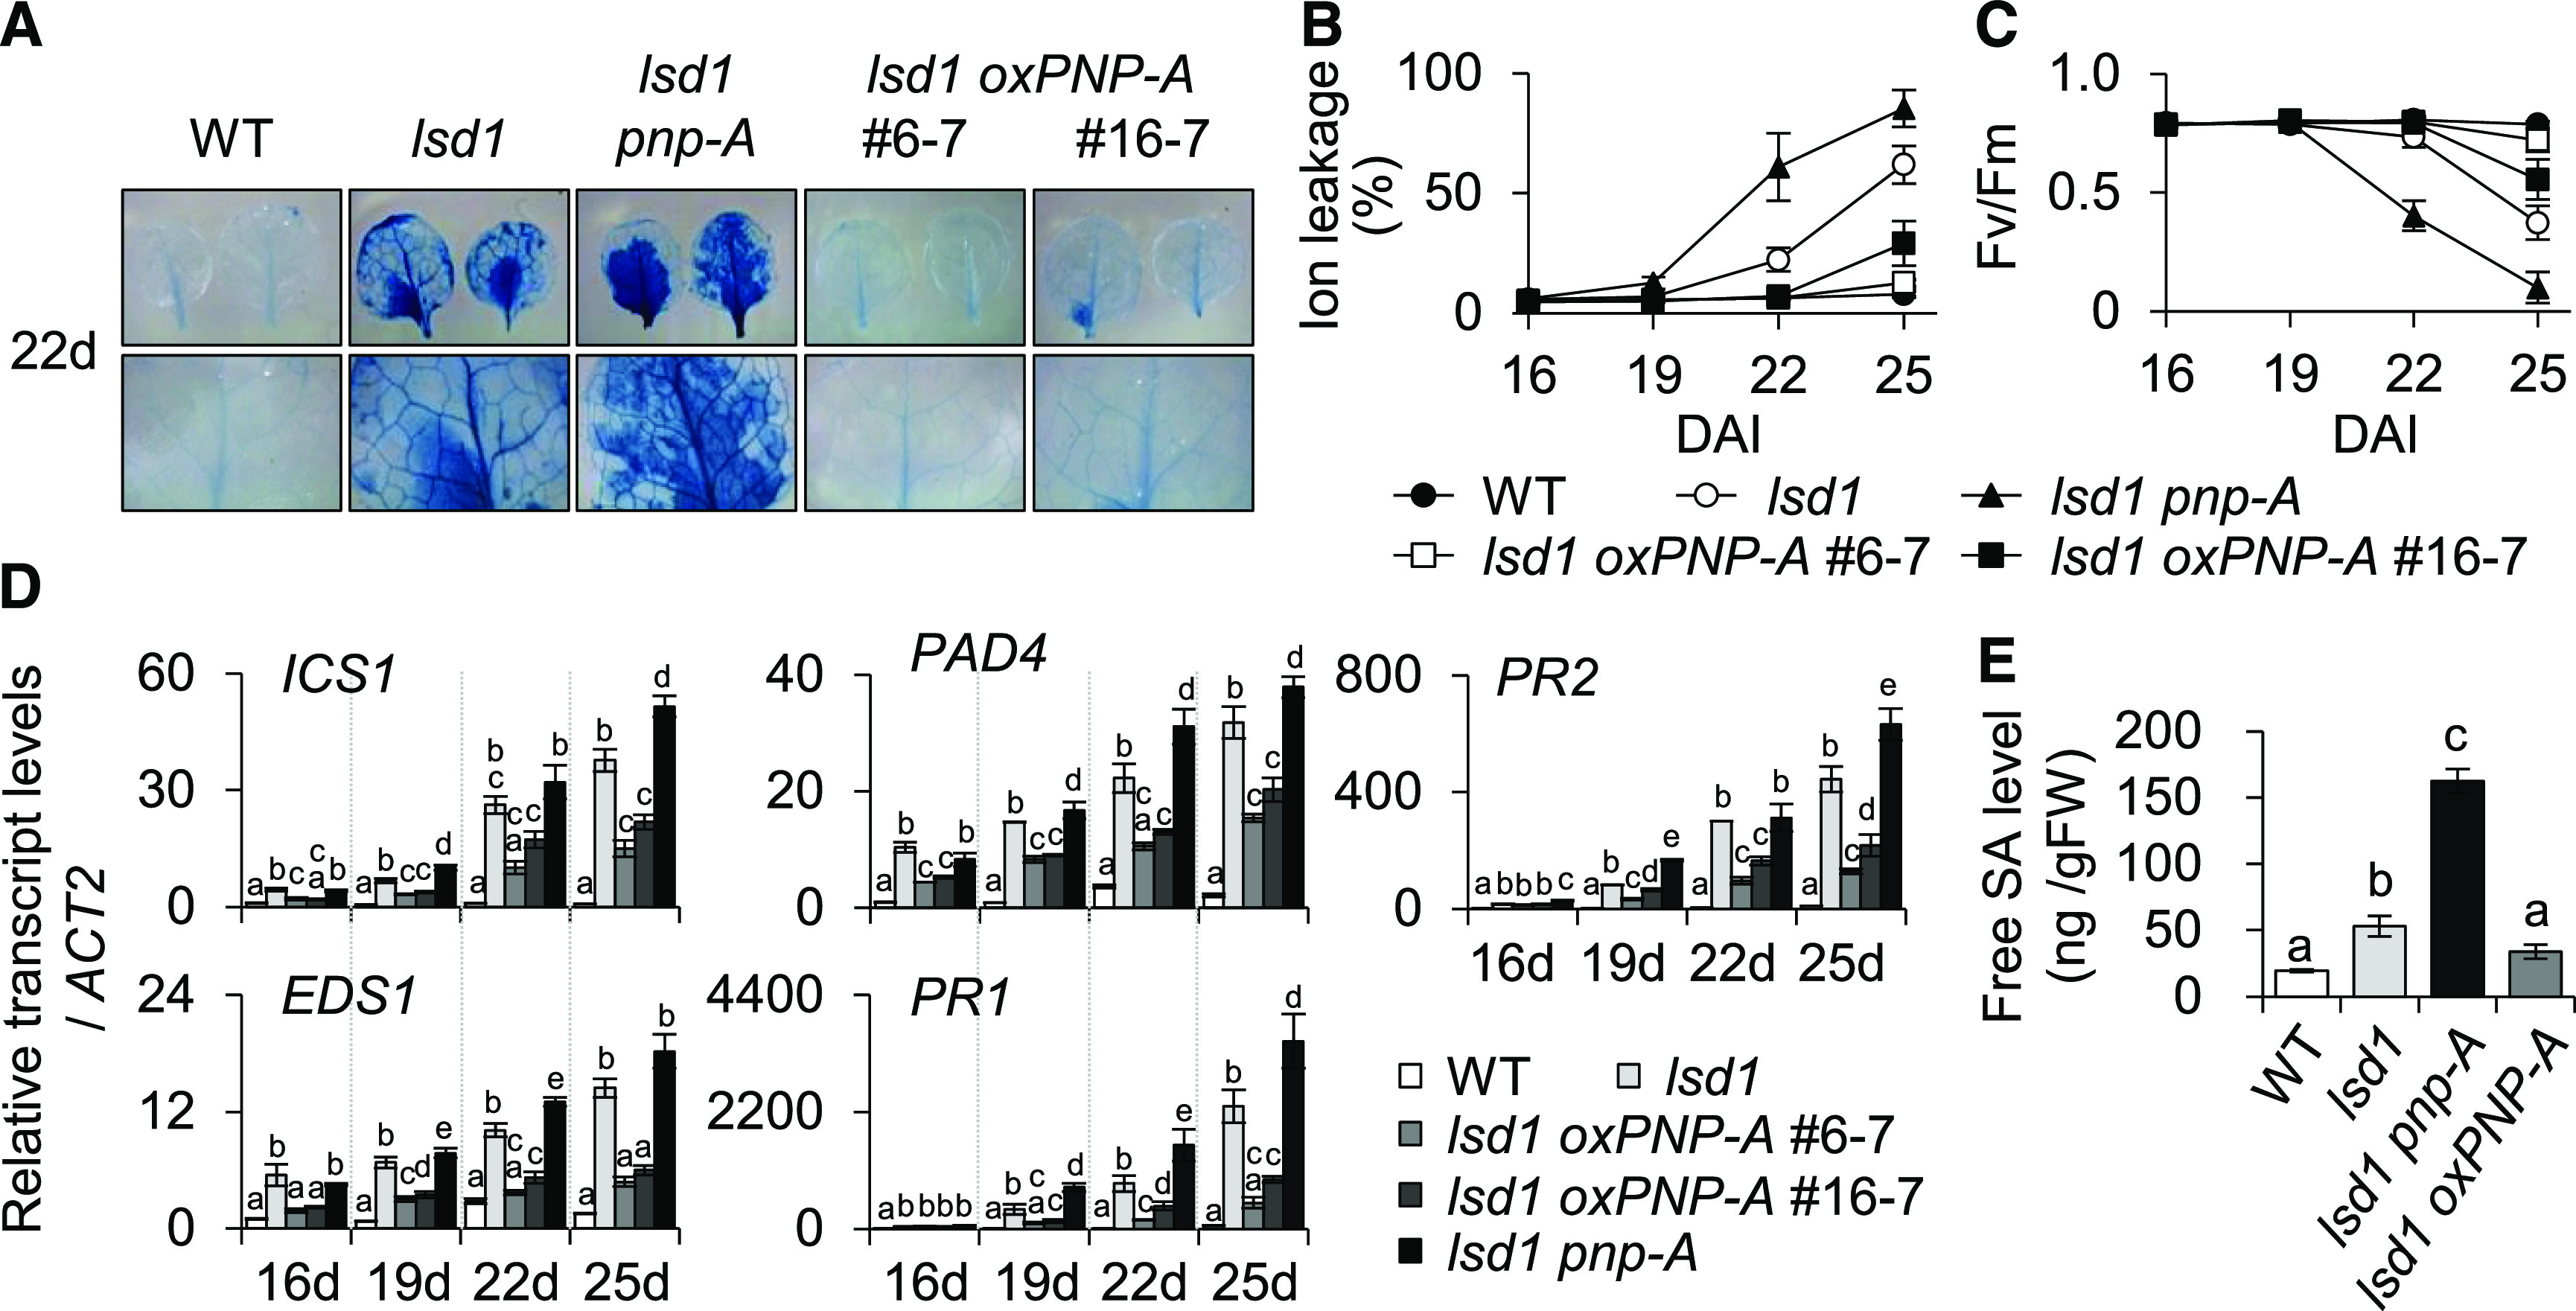
Figure 2.

PNP-A Acts to Repress lsd1 RCD.
(A) Twenty 2-d-old plants of the wild-type (WT), lsd1, lsd1 pnp-A, and two independent PNP-A–overexpressing lsd1 transgenic lines (lsd1 oxPNP-A #6-7 and #16-7) grown under CL were collected to examine leaf RCD. (First row) RCD phenotype in the first or second leaves from each genotype was visualized by TB staining. (Second row) Images of the first row are enlarged.
(B) and (C) For measurements of ion leakage (B) and Fv/Fm (C), first or second leaves from plants were harvested at the indicated time points. Ten leaves per genotype were used for the measurement of Fv/Fm. Value in (B) represents means ± sd (n = 3). DAI, days after imbibition; WT, wild type.
(D) Expression levels of genes involved in SA biosynthesis (ICS1, EDS1, and PAD4) and SA response (PR1 and PR2) were examined by RT-qPCR at the indicated time points. ACT2 was used as an internal standard. The data represent the means of three independent biological replicates. Error bars indicate sd. WT, wild type.
(E) Endogenous free SA levels were examined in 16-d-old plants of the wild type (WT), lsd1, lsd1 pnp-A, and lsd1 oxPNP-A #6-7 grown on MS medium under CL. Value represents means ± sd (n = 2). Lowercase letters in (D) and (E) indicate statistically significant differences between mean values (P < 0.05, one-way ANOVA with post hoc Tukey’s honestly significant difference [HSD] test; Supplemental Data Set). FW, fresh weight.
