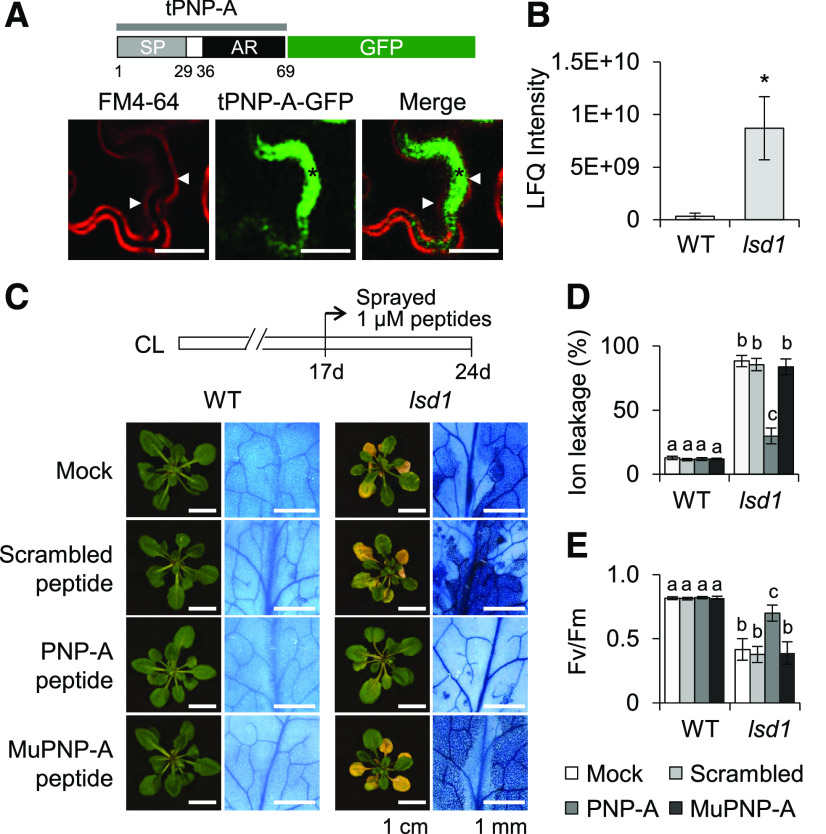
Figure 3.
PNP-A Is Localized to the Apoplastic Space, and Exogenous Application of the PNP-A Synthetic Peptide Significantly Compromises lsd1 RCD.
(A) Localization of the tPNP-A (Met-1 to Tyr-69), including SP and active region (AR), fused with GFP (PNPA-GFP) upon transient expression in N. benthamiana leaves. FM4-64 was used to stain PM. Cell plasmolysis was performed by treatment of 0.8 M mannitol for 30 min. An asterisk indicates the apoplastic space formed by the shrinking protoplast, and triangles indicate the retracted PM. Bar = 20 µm.
(B) Mass spectrometry–based detection of PNP-A proteins in the apoplast. Apoplast proteins extracted from 21-d-old wild-type (WT) and lsd1 plants grown under CL were analyzed by mass spectrometry. The relative levels of PNP-A were quantified using the total intensity of the detected peptides (see Supplemental Figures 3A and 3B). The results represent the means of two independent biological replicates. Error bars indicate se. Asterisk indicates statistically significant difference from mean value of WT by Student’s t test (P < 0.05; Supplemental Data Set). LFQ, label-free quantitation.
(C) to (E) Seventeen-day-old wild-type (WT) and lsd1 plants grown under CL were treated with water (Mock) or 1 µM scrambled, active (PNP-A) or Cys-mutated (MuPNP-A) form of PNP-A synthetic peptide (for details on the synthetic peptides compared with the active PNP-A, see Supplemental Figure 4). After 7 d of the treatment, the relative levels of foliar RCD were determined by TB staining (C), ion leakage (D), and Fv/Fm (E) measurements. The representative images are shown at the same scale. For the measurement of Fv/Fm, 10 leaves per genotype were used. Value in (D) represents means ± sd (n = 3). Lowercase letters indicate statistically significant differences between mean values (P < 0.05, one-way ANOVA with post hoc Tukey’s honestly significant difference [HSD] test; Supplemental Data Set).

