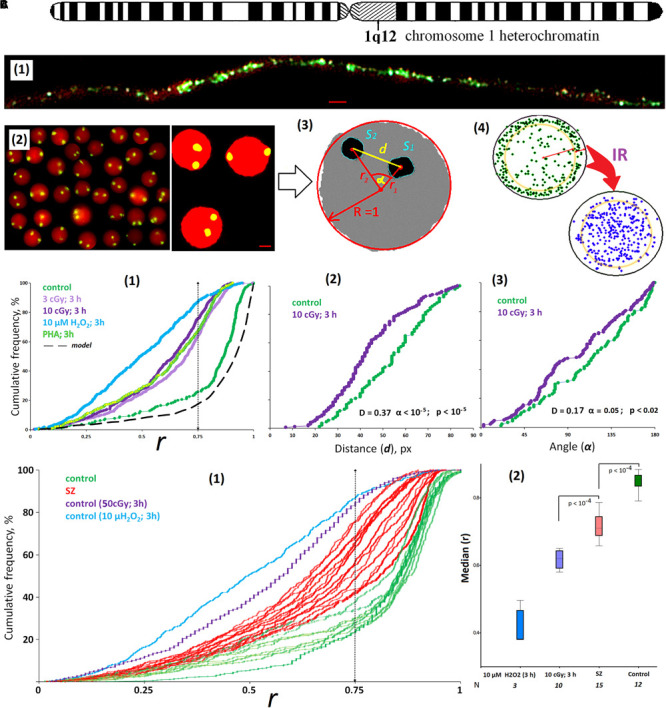
FIGURE 1.

ROS induces the movement of 1q12 loci from the membrane into the nucleus. (A) (1) Fiber-FISH chromatin 1q12 analysis with the f-Sat III probe PUC1.77. Repeat clusters of f-SatIII (green) alternate with other repeats (red, PI) of a given region of the chromosome 1. (2) The example of the FISH result obtained for the control cells. 1q12 loci are represented in the nucleus (red, PI) by two fluorescent signals (green). Gallery of the cells was formed from multiple photos. Bars, 5 μm. (3) Example of the nucleus image analysis. Image processing includes determining the center of gravity of the FISH signal, the radius vectors of the signals (r1 and r2), the distance and angle between the signals (d and α), the area of the FISH signals (S1 and S2), and radius R and area S of the nucleus. The radius vector r is normalized to the value of the radius of the nucleus R and varies from 0 (center of the nucleus) to 1 (surface of the nucleus). (4) The total arrangement of FISH signals on the plane in the control sample (green) and the irradiated sample (violet). In the control nuclei, signals with r > 0.75 are more common. In irradiated nuclei (10 cGy, 3 h), signals with r < 0.75 are more common. (B) (1) Cumulative histograms of the frequency distribution of the FISH signals by the radius vector r (0: center of the nucleus) for intact, irradiated (3 and 10 cGy), H2O2-treated, and PHA-stimulated G0 human lymphocytes. Dotted line, 3D–2D simulation under the assumption that FISH signals are located on the surface of a flattened sphere modeling the cell nucleus located on the slide. Note: distributions of the r values for irradiated HC (3 and 10 cGy) differ significantly from non-irradiated HC: D = 0.51, α < 10–34 (Kolmogorov–Smirnov); p < 10–50 (U-test). (2,3) The distance and angle between the two FISH signals for intact and irradiated (10 cGy) human lymphocytes. (C) (1) Cumulative histograms of the frequency distribution of the FISH signals by the radius vector r for HC (N = 10) and SZ groups (N = 15). (2) The values of the medians of the radius r for the HC group, for irradiated or H2O2-treated HC cells, and for the SZ cells. Note: Before the FISH nuclei were treated with RNase A.
