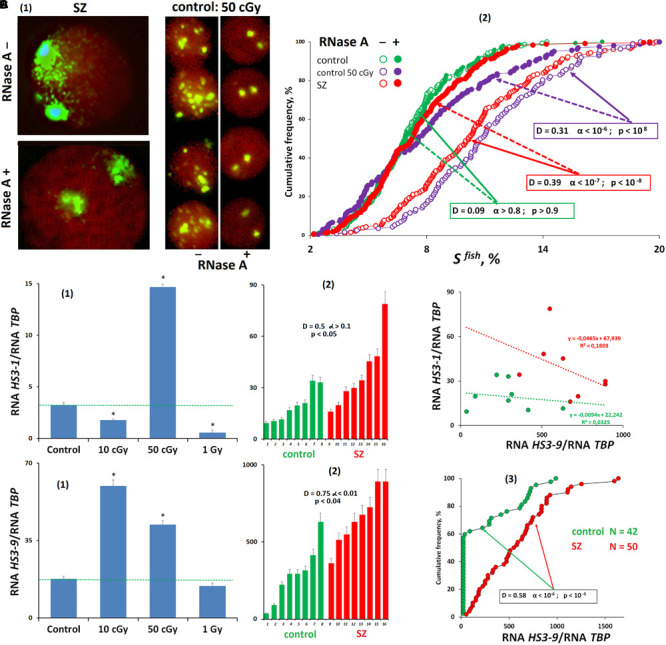
FIGURE 3.

Transcription of satellite III in human cells. (A) Processing the nuclei with RNase A reduces the FISH-signal area. (1) Examples of the nuclei of SZ patients and nuclei of irradiated HC cells treated and untreated with RNase A before the FISH. (2) Cumulative histograms of the frequency distribution of the FISH signals by the square SFISH for treated and untreated with RNase A intact HC, irradiated HC (50 cGy, 48 h), and SZ lymphocytes. (B) Transcription of f-SatIII DNA (HS3-1). (1) Irradiated lymphocytes (72 h after exposure). (2) White blood cells of SZ and HC groups. (C) Transcription of satellite III located on chromosome 9 (HS3-9). (1) Irradiated lymphocytes (72 h after exposure). (2,3) White blood cells of SZ and HC groups. (D) Dependence of the amount of RNA HS3-1 on the amount of RNA HS3-9 for two groups.
