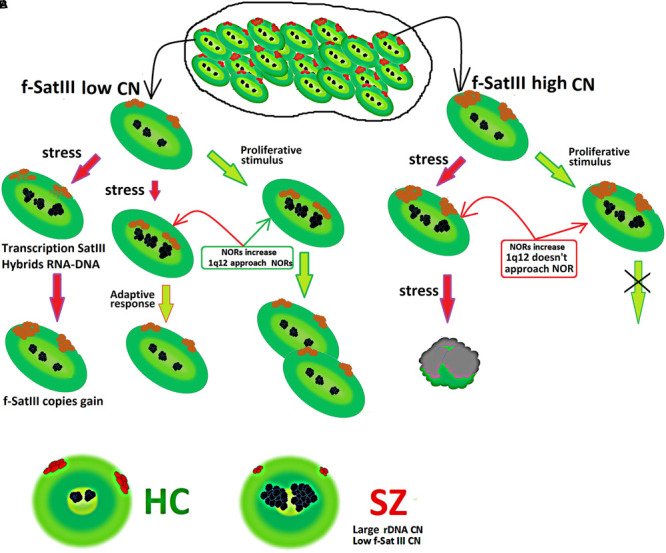
FIGURE 6.

(A) Scheme showing a change in the content of f-SatIII in a cell population under stress. A detailed description is given in the text. (B) Illustration of f-SatIII and rDNA tandem repeats sizes in HC and SZ groups.

(A) Scheme showing a change in the content of f-SatIII in a cell population under stress. A detailed description is given in the text. (B) Illustration of f-SatIII and rDNA tandem repeats sizes in HC and SZ groups.