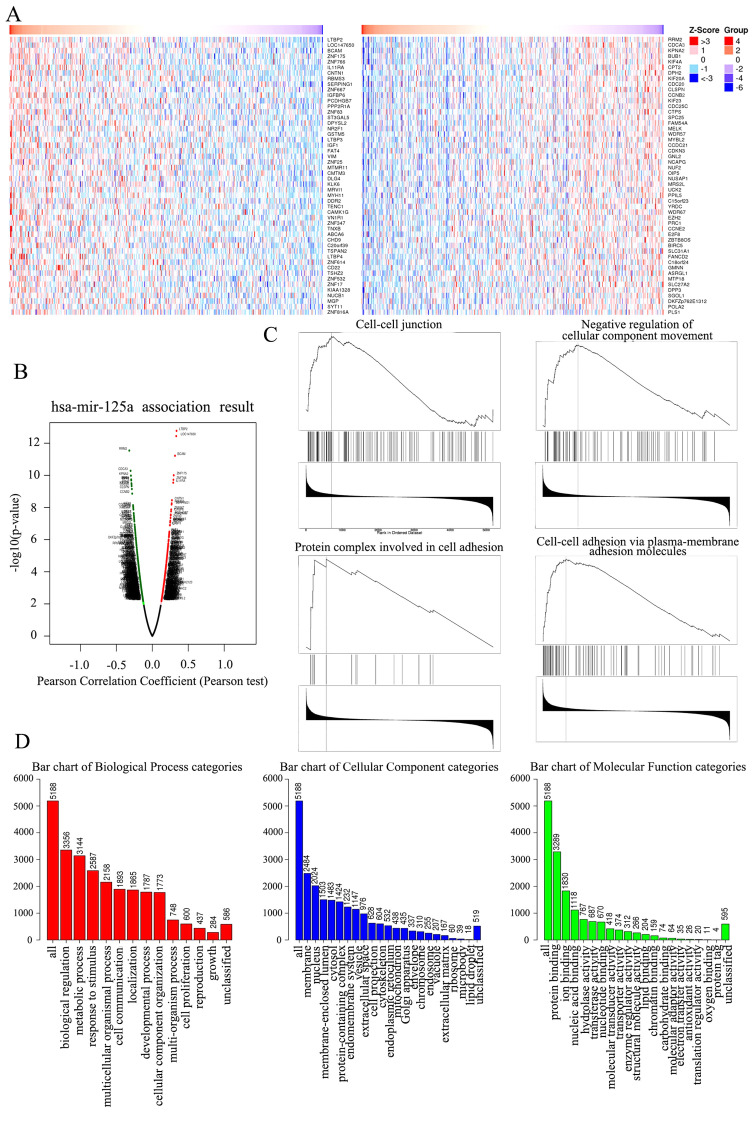
Figure 4.
Heat map, Volcano plot, GSEA and GO enrichment assay in ovarian of key genes targeted by miR-125a-5p. (A) Heat map of the positive DEGs (left) and negative DEGs (right) targeted by miR-125a-5p in TCGA database. (B) Volcano plot of the DEGs targeted by miR-125a-5p in TCGA database, the red dots and green dots represent the upregulated and downregulated, respectively. (C) The four enrichment plots from the GSEA results, including ‘cell-cell junction’, ‘negative regulation of cellular component movement’, ‘protein complex involved in cell adhesion’ and ‘cell-cell adhesion via plasma-membrane adhesion molecules’. (D) GO analysis results of DEGs. GO, Gene Ontology; miR, microRNA; DEGs, differentially expressed genes; GSEA, Gene Set Enrichment Analysis; TCGA, The Cancer Genome Atlas.

