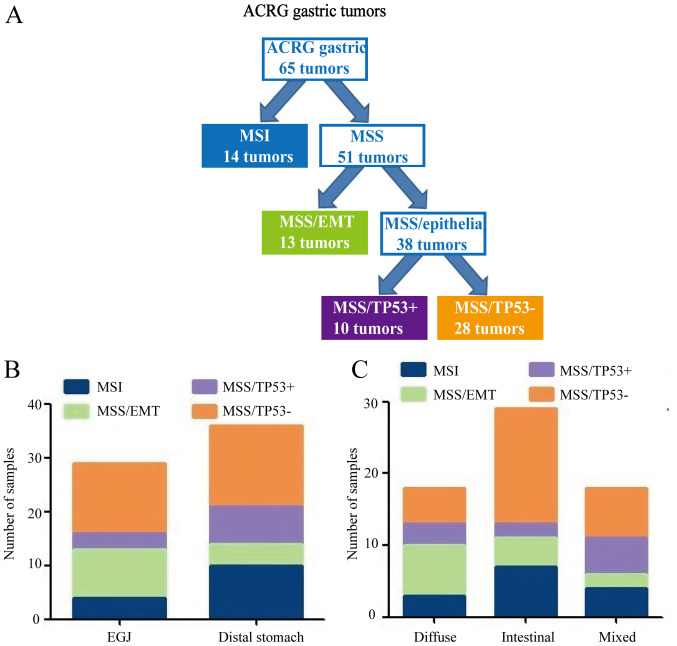
Figure 5.
ACRG molecular classification of GC. (A) Flow diagram illustrating how GC divided according to ACRG molecular classification. (B) Differences in tumor location among subtypes. (C) Differences in Lauren classification among subtypes. ACRG, Asian Cancer Research Group; GC, gastric cancer; MSI, microsatellite instability; MSS, microsatellite stable; EMT, epithelial-mesenchymal transition; TP53, tumor protein 53; EGJ, gastro-esophageal junction.

