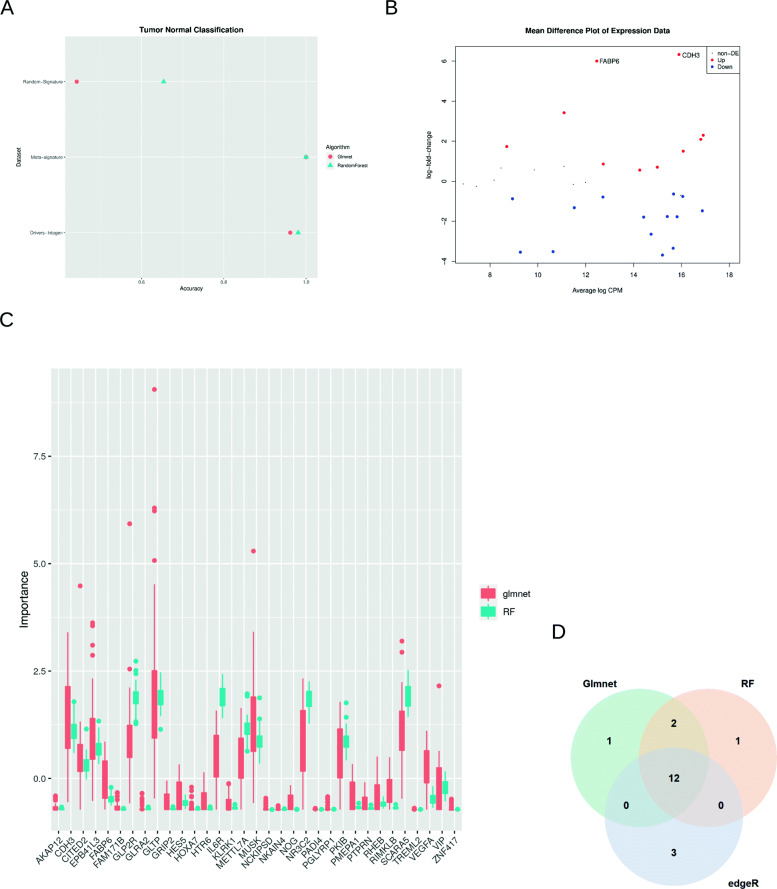
Fig. 3.
Results of analyisis prediction from tumor and helath tissues. a) A comparative ML task was carried out with three different signatures (Random signature, Meta signature and Drivers Intogen) to predict between tumor and helth tissues. TCGA expression values of these three signatures were the input in training phase for two ML algorithms (Random Forest and glmnet). The accuracy of the models for each signature is shown. b) Mean difference plot after differencial gene expressión is shown. Up and Down expression genes are highlighted in red and blue respectively. FABP6 and CDH3 were the genes with major gene expression differences. c) Comparative variable importance for metasignature in Random Forest and glment algorithms. Values were scaled for comparative analysis. d) Pie chart with intersections of same genes obtained by two ML approaches and differential gene expression. The three approaches obtained very similar conclusions

