Fig. 1.
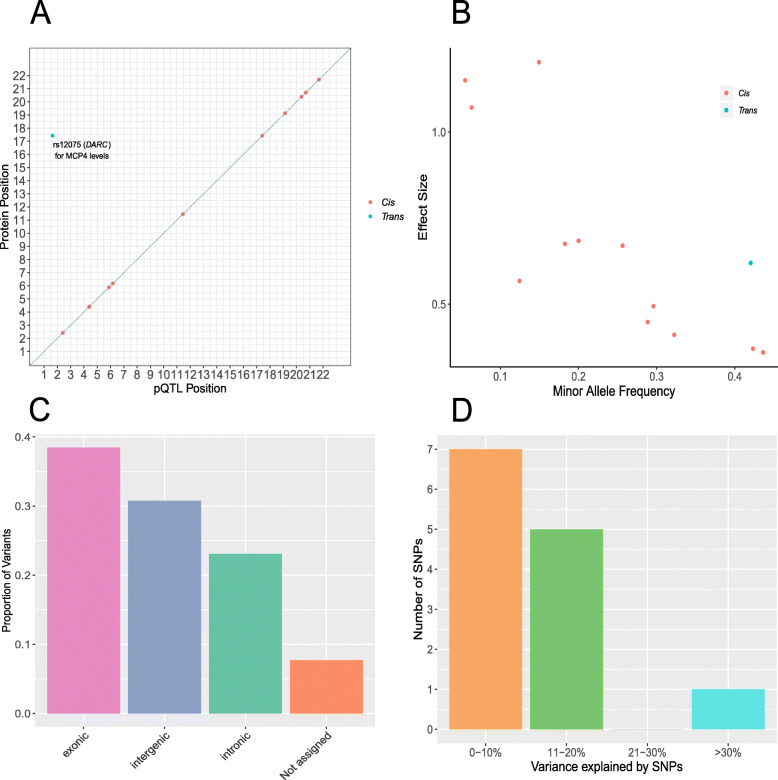
Genetic architecture of inflammatory protein biomarkers in the Lothian Birth Cohort 1936. a Chromosomal locations of pQTLs concordant between Bayesian penalised and ordinary least squares regression models for genome-wide association studies (n = 13 pQTLs). The x-axis represents the chromosomal location of concordantly identified cis and trans SNPs associated with the levels of Olink® inflammatory proteins. The y-axis represents the position of the gene encoding the associated protein. The sole conditionally significant concordant trans association is annotated. Cis (red circles); trans (blue circles). b Absolute effect size (per standard deviation of difference in protein level per effect allele) of pQTLs versus minor allele frequency. Cis (red circles); trans (blue circles). c Classification of 13 pQTLs by function as defined by functional enrichment analysis in FUMA. d Variance in protein levels explained by pQTLs (estimates from Bayesian penalised regression are displayed)

