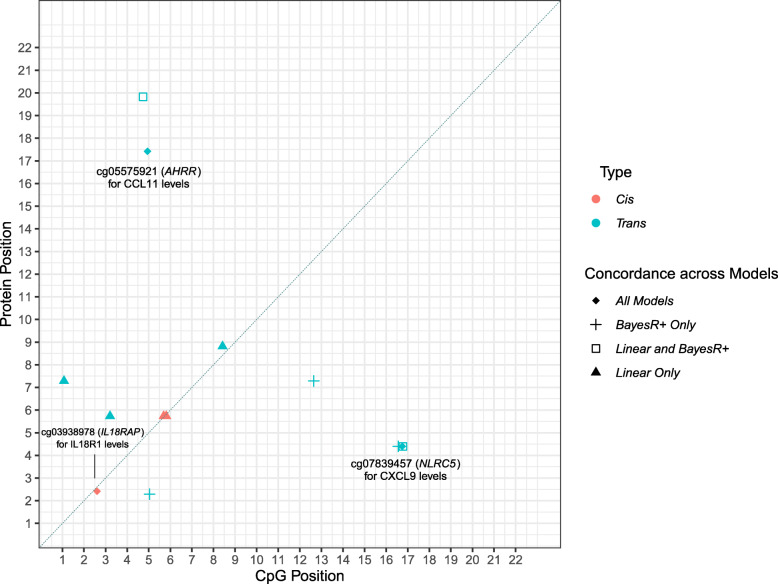
Fig. 4.
Genomic locations of CpG sites associated with differential inflammatory protein levels. The x-axis represents the chromosomal location of CpG sites associated with the levels of Olink® inflammation biomarkers. The y-axis represents the position of the gene encoding the associated protein. The level of concordance across three models used to perform epigenome-wide association studies is represented by different shape patterns. Those CpG sites (n = 3) which were identified by linear (ordinary least squares), mixed model and Bayesian penalised regression models, and passed a Bonferroni-corrected significance threshold are represented by diamonds and annotated. Three proteins (CXCL9, CXCL10 and CXCL11) were associated with differential methylation levels at the cg07839457 site in the NLRC5 transcription factor locus. Additionally, two proteins (CCL11 and TGF-alpha) were associated with the smoking-associated cg05575921 site in the AHRR locus. Cis (red); trans (blue)

