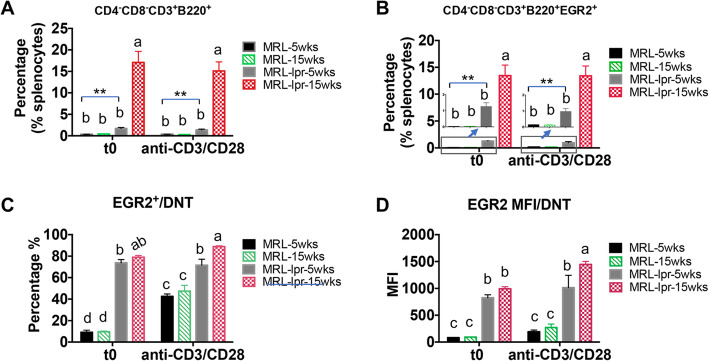
Fig. 5.
T cell activation has limit effect on the induction of EGR2 in DNT cells of MRL-lpr mice. The splenocytes were prepared and stained as described in Fig. 4 legend. The cells were firstly gated on CD4−CD8− cells, and then gated on CD3+B220+ cells to identify the percentage of DNT (CD4−CD8−CD3+B220+) cells (a) and EGR2 expressing DNT cells in whole splenocytes (b). The graphs show the summary of the percentage of EGR2 expression (c) and EGR2 expression intensity (MFI) (d) in gated DNT cells from MRL and MRL-lpr splenocytes at resting and activation state. Graphs show means ± SEM (n ≥ 4). One-way ANOVA with Tukey- Kramer all pair’s comparisons were performed for statistical analysis. The groups that were not connected with the same letter were significantly different in their means

