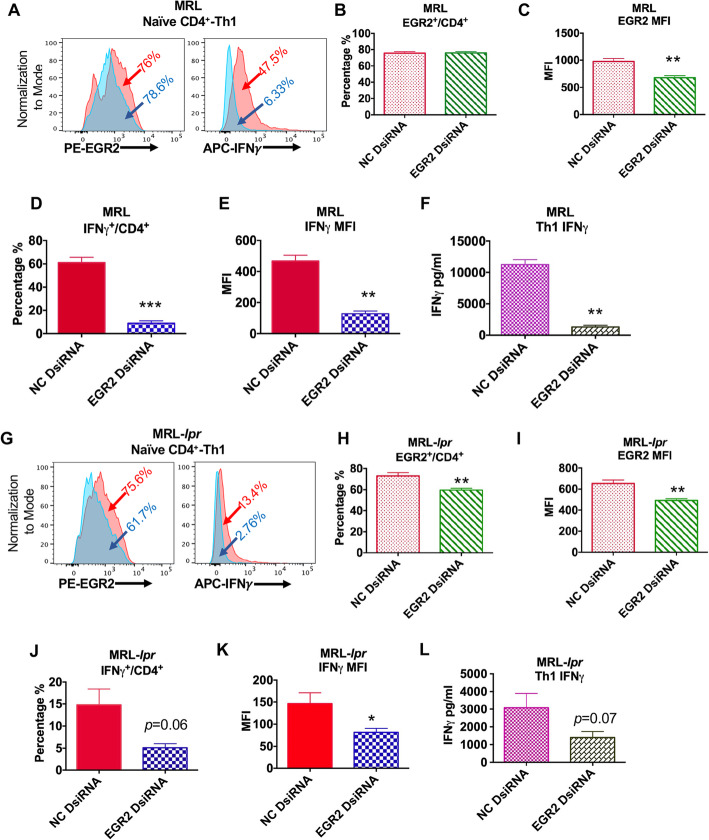
Fig. 8.
Inhibition of EGR2 suppresses Th1 differentiation of naïve CD4+ T cells from both MRL and MRL-lpr mice. Naïve CD4+ T cells from MRL and MRL-lpr mice at 6–8-week-old were transfected with NC (red) and EGR2 (blue) dsiRNA, respectively. Twenty-four hours after transfection, the cells were cultured at Th1 condition for 3 days. The Th1 cell culture supernatant were collected for ELISA; the cells were stimulated with PMA and ionomycin for 5 h for intracellular flow analysis. (a & g) The representative histogram plots show the EGR2 and IFNγ expression in the Th1 cells differentiated from NC and EGR2 DsiRNA treated MRL (a) and MRL-lpr (g) naïve CD4+ T cells. (b-e and h-k) The summary graphs show the percentage of EGR2 expressing cells (b, h), EGR2 expression intensity (c & i), the percentage of IFNγ expressing cells (d, j), IFNγ expression intensity (e, k) in Th1 cells differentiated from DsiRNA treated MRL and MRL-lpr naïve CD4+ T cells. (f & l) ELISA analysis of IFNγ in Th1 culture supernatant of DsiRNA-treated MRL (f) and MRL-lpr (l) naïve CD4+ T cell. Graphs show means ± SEM (n = 4 each). Paired student t-tests (NC vs EGR2 DsiRNA); *, p < 0.05, **, p < 0.01, and ***, p < 0.001

