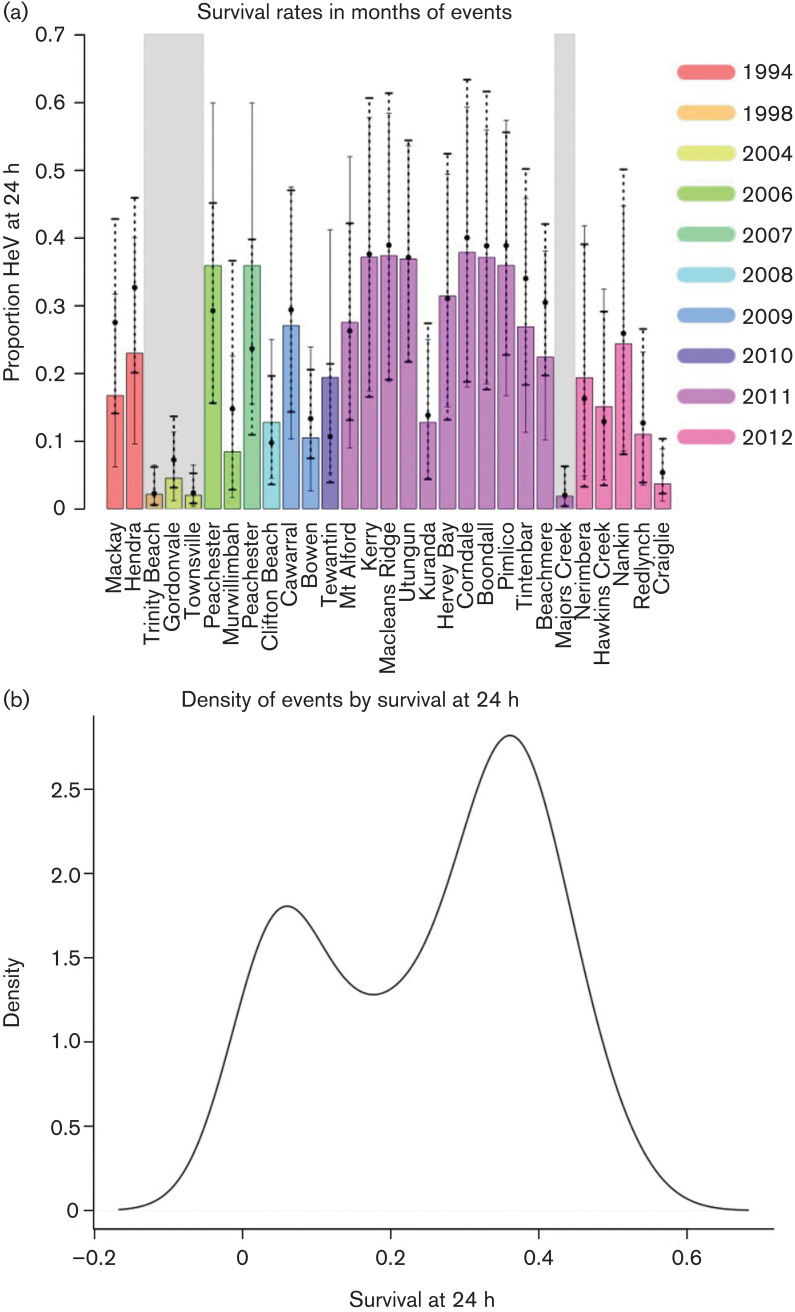
Fig. 3.
(a) Comparison of the proportion of HeV surviving 24 h after excretion at the mean temperature conditions between 1993 and 2012 (coloured bars) at each of the spillover locations and the mean temperature of the month where spillover events occurred (black points). Thin continuous error bars show 95 % CIs for temperature between 1993 and 2012. Dashed error bars show 95 % CIs of HeV survival for the month of spillover. Location of the point with respect to the thin error bars indicates how different the month of spillover was from the most common conditions (coloured bars). The grey shaded areas indicate the events that occurred in summer. Results are only shown for locations where reliable temperature data were available from a meteorological station. (b) Bimodal distribution of HeV spillover events with respect to potential virus survival.

