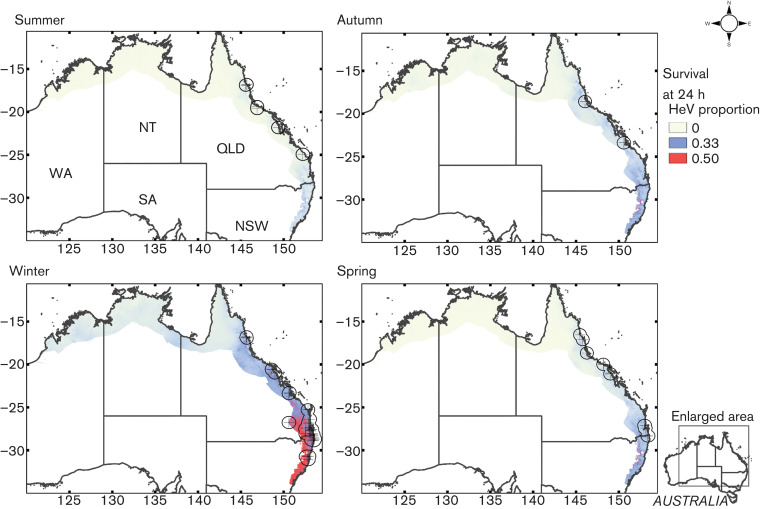
Fig. 4.
Maps showing the amount of HeV surviving 24 h after being excreted whilst temperature is the mean minimum for each season. Crosses show the locations of spillover events and circles correspond to the buffers used in the statistical analyses. Events were divided into season of occurrence. WA, Western Australia; NT, Northern Territory; SA, South Australia; QLD, Queensland; NSW, New South Wales. The x- and y-axes show longitude and latitude, respectively.

