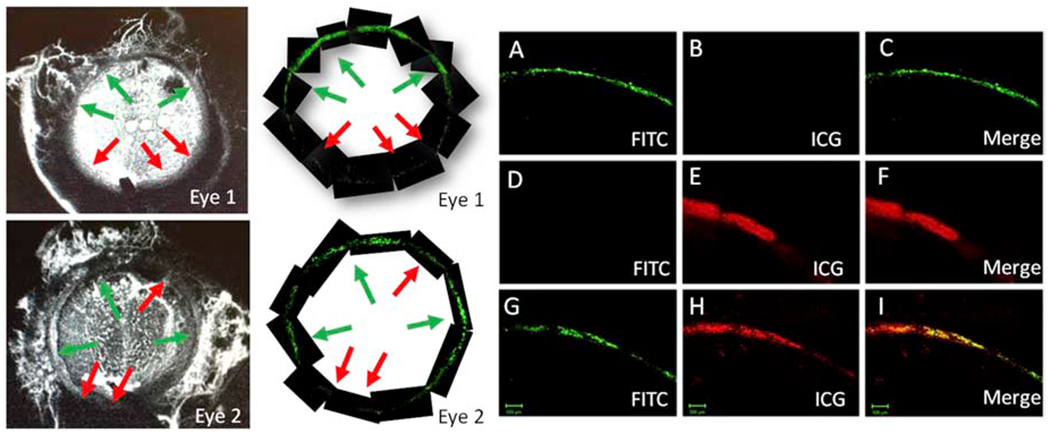
Figure 1. Aqueous Angiography with ICG and Fluorescent Beads in Post-Mortem Human Eyes.

Two eyes (Eyes 1 and 2) received fluorescent beads (FITC) diluted in ICG. Left Column: Indocyanine green (ICG) images taken at 5 min. Middle Column: Fluorescent bead imaging of the TM taken at 1 hour. High- and low-flow regions are denoted with green and red arrows, respectively. Note how the high- and low-flow regions match between the aqueous angiographic and bead-based methods. A-I) Then, using two-photon microscopy more detailed images of the TM were obtained. A-C) TM images from an eye that only received fluorescent beads. D-F) TM images from an eye that only received ICG. G-I) TM images from an eye (this is also Eye 1) that received both fluorescent beads and ICG.
